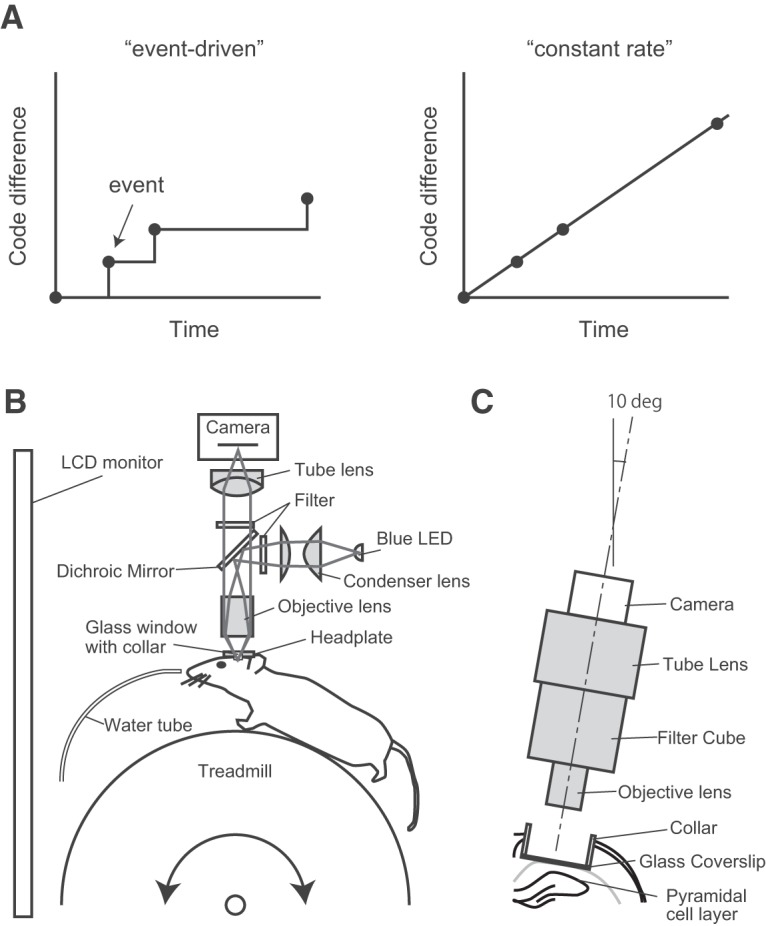
Figure 1.

Two models for the dynamics of place-cell activity and schematic view of the experimental apparatus. A, Left, A new place code is assigned for each new episode. In this case, the rate of change will depend on the frequency of the experience. Right, Place codes change automatically and at constant speed. In this case, the rate will always be constant. B, Simplified schematic representation of the imaging system. The blue line indicates the illumination pathway, and the green line indicates the light collection pathway. Illumination light from a blue LED was collected with a condenser lens, passed through an excitation filter, reflected off a dichroic mirror, and irradiated through an objective lens. The fluorescence image was focused on a CMOS camera. C, Schematic representation of the experimental setup showing the chronic window implant above CA1. The optical axis of the fluorescence microscope was angled at 10°.
