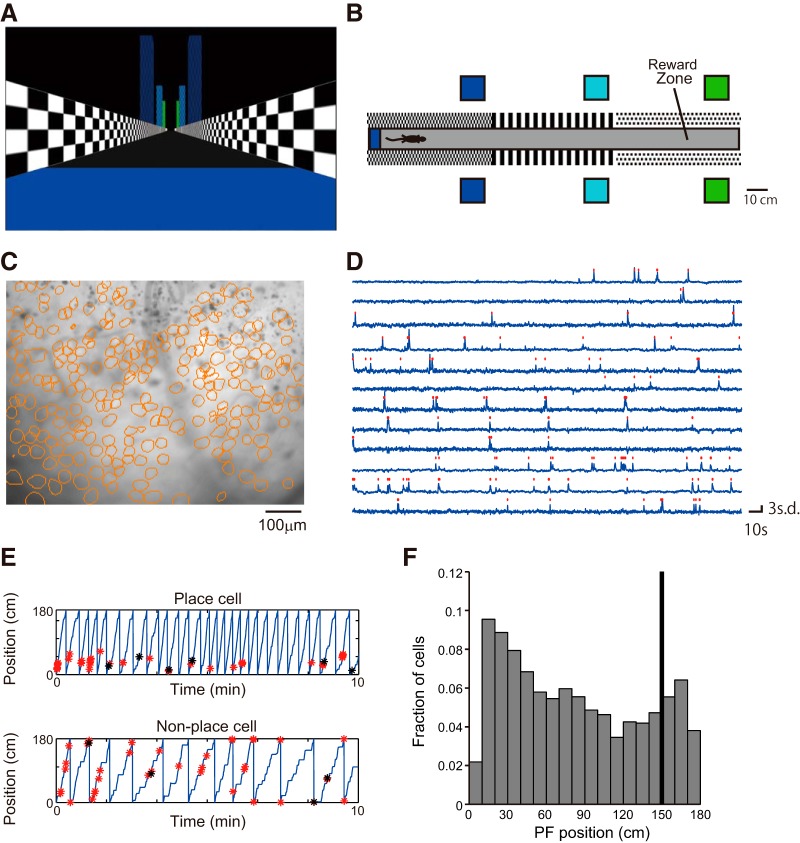
Figure 2.
Hippocampal activity during the VR task. A, View from the start point of the virtual linear track. B, Top view of the track. C, Sample image of mean fluorescence during an imaging session. The contours of cells extracted from the fluorescent imaging movie are shown in orange circles (236 cells). D, Relative fluorescence changes (dF/F) for 12 cells. Identified calcium transients are shown as red dots. E, Representative CA1 cell activity. Top, Place cell (mutual information = 1.7, Monte Carlo p value = 0.00); bottom, nonspecific cell (mutual information = 0.13, Monte Carlo p value = 0.48). The position of the mouse along the virtual track is shown by the blue line. Identified calcium activities during running are shown with red asterisks, and those during rest are shown with black asterisks. F, Histograms of place-field position along the linear track. The black bar indicates the reward position.

