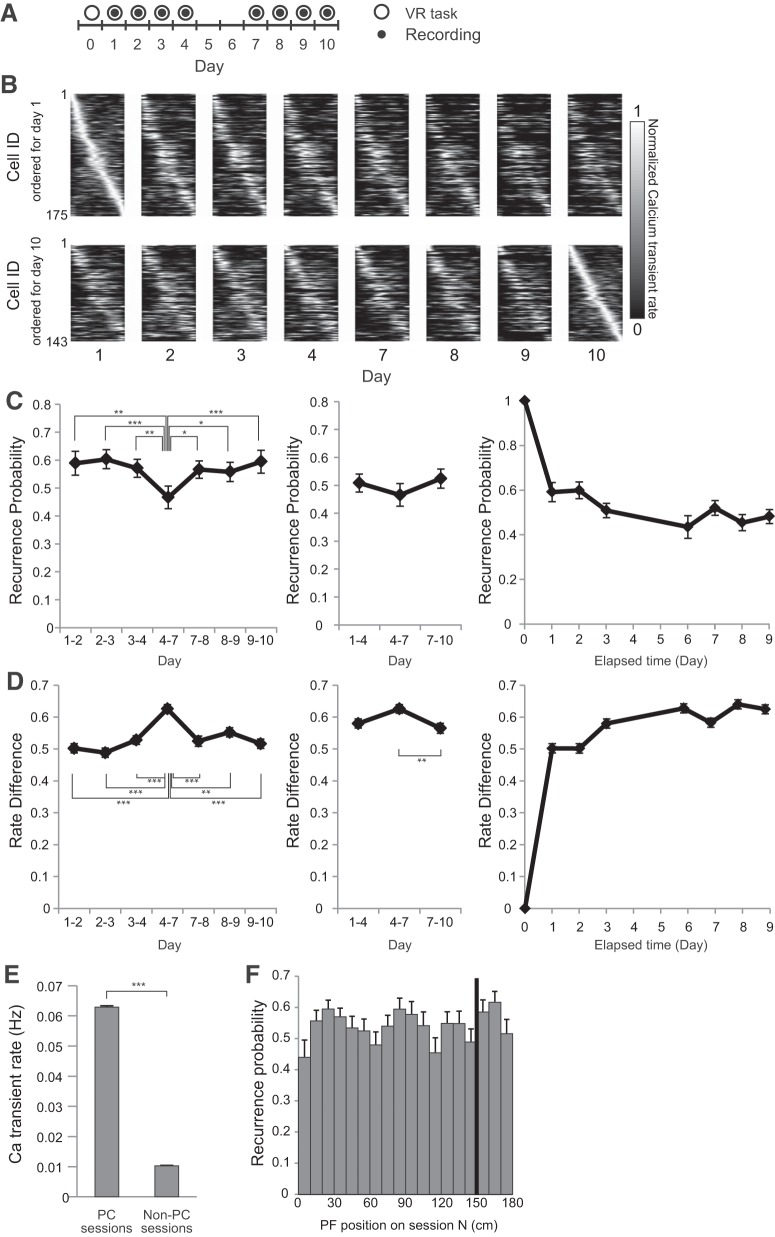
Figure 3.
Long-term imaging of CA1 place-cell activity. A, Experimental timeline. After at least 3 weeks of pretraining, a series of four recording sessions was conducted on Days 1–4; another series of four recording sessions was conducted on Days 7–10. B, Place-field maps for the same cells on multiple days of the recording session. Maps are ordered by the place fields' centroid position on Day 1 (top) and Day 10 (bottom). The peak calcium event rate for each cell was normalized to one. C, If a cell had a statistically significant place field in one session, the odds that it had a place field in a subsequent session were displayed as recurrence probability. Left, Recurrence probability for adjacent sessions. Middle, Recurrence probability for sessions with a 3 d interval. Right, Recurrence probability between first day session and other sessions. D, Left, Changes in the peak transient rates (rate difference) for adjacent sessions. Middle, Rate difference for sessions with a 3 d interval. Right, Rate difference between first day session and other sessions. E, Calcium transient rates of the cells showing place-cell activity for at least 1 d. The rates for sessions when they exhibited place-cell activity are shown as PC sessions, whereas the rates for sessions when they did not are shown as Non-PC sessions. F, The distribution of recurrence probability as a function of place-field position. The black bar indicates the reward position. Data are shown as mean ± SEM. Asterisks indicate significant differences: *p < 0.05, **p < 0.01, ***p < 0.001; otherwise not significant.

