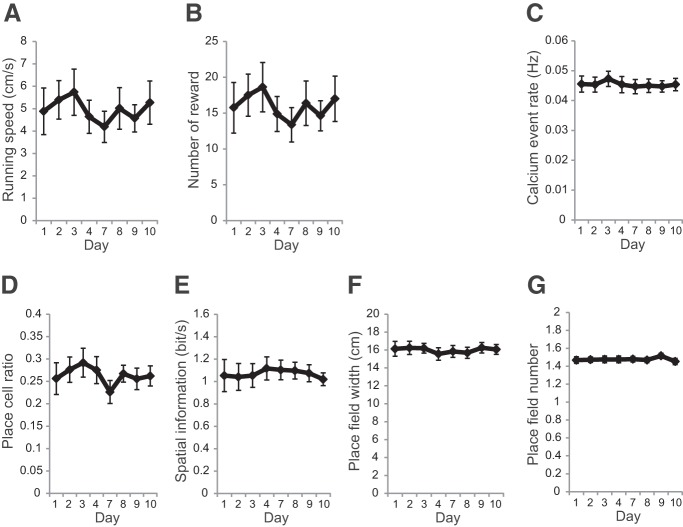
Figure 4.
Behavioral properties and place-cell properties in the long-term recording experiment. A, Running speed at each recording session. Significance was evaluated by Friedman test (Q = 6.7, p = 0.46, n = 8). B, Number of rewards at each session. Significance was evaluated by Friedman test (Q = 6.9, p = 0.44, n = 8). C, Calcium event rate. Significance was evaluated by one-way repeated-measures ANOVA (F(2,21) = 1.5, p = 0.19, n = 8). D, Fraction of cells with significant place cells. Significance was evaluated by Friedman test (Q = 10, p = 0.19, n = 8). E, Spatial information content of place cells per unit time. Significance was evaluated by one-way repeated-measures ANOVA (F(2,21) = 0.33, p = 0.94, n = 8). F, Place-field size for each cell. Significance was evaluated by one-way repeated-measures ANOVA (F(2,21) = 0.65, p = 0.71, n = 8). G, Number of place field for each cell. Significance was evaluated by Friedman test (Q = 3.9, p = 0.79, n = 8). Data are shown as mean ± SEM.

