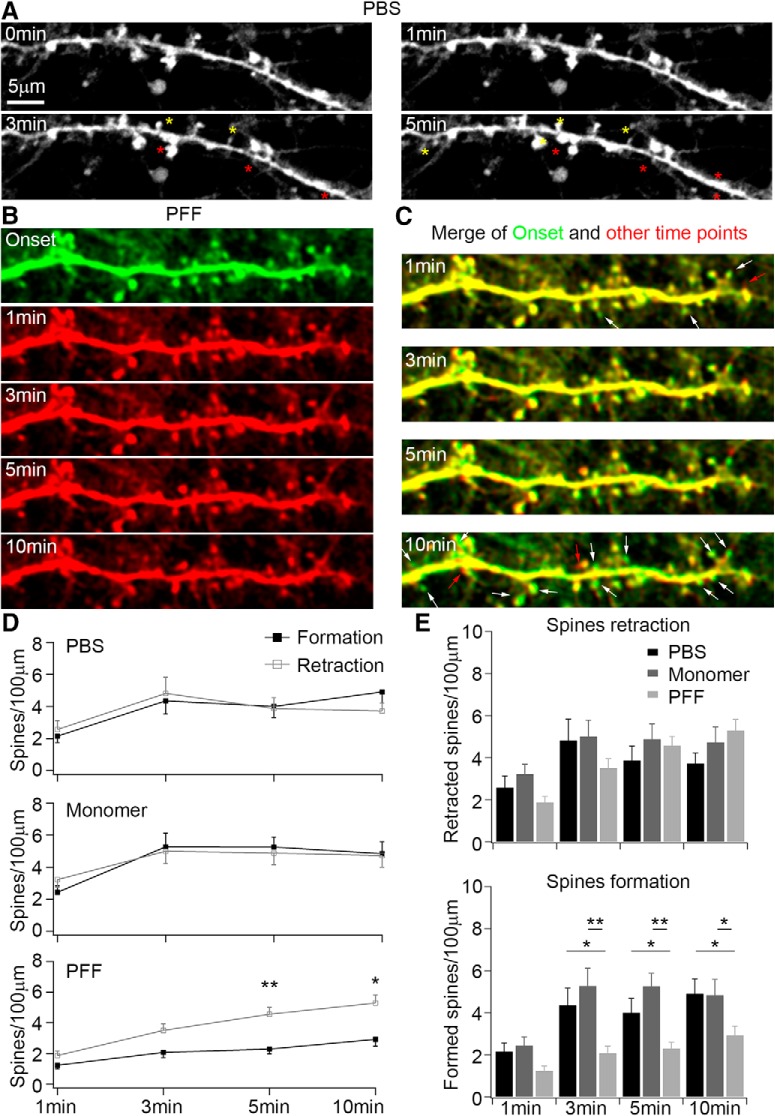
Figure 9.
Passive infusion of αSyn PFFs from patch-clamp pipettes altered dendritic spine dynamics. A, Time-lapse imaging of dynamic changes of dendritic spines in PBS-infused neurons. Dendritic spines were labeled with GFP-expressing lentivirus at 10 DIV and confocal z-stack images were taken at 17–20 DIV at 30 s intervals. Yellow stars indicate the newly formed spines; red stars indicate the retracted spines during infusion and imaging. B, Time-lapse imaging of dynamic changes of dendritic spines in αSyn PFF-infused neurons. For a better comparison of dynamic changes of dendritic spines, the “onset” of imaging was pseudocolor-labeled with green; the other time points after the onset were labeled with red. C, Merged images of onset and other time points from B. The red arrows indicate the newly formed spines during αSyn PFFs infusion; the white arrows indicate the retracted spines. Scale bars: A–C, 5 μm. D, Quantification of spine dynamic changes under different treatment conditions. E, Quantifications of the rate of retraction and formation of spines under different treatment conditions. Experiments have been performed with three independent repeats for PBS and monomer, four independent repeats for αSyn PFF. Cell number n = 8 for PBS, n = 10 for monomers, n = 17 for αSyn PFF. Results shown as mean ± SEM. *p < 0.05, **p < 0.01; Student's t test (D) and one-way ANOVA with Tukey post hoc test (E).

