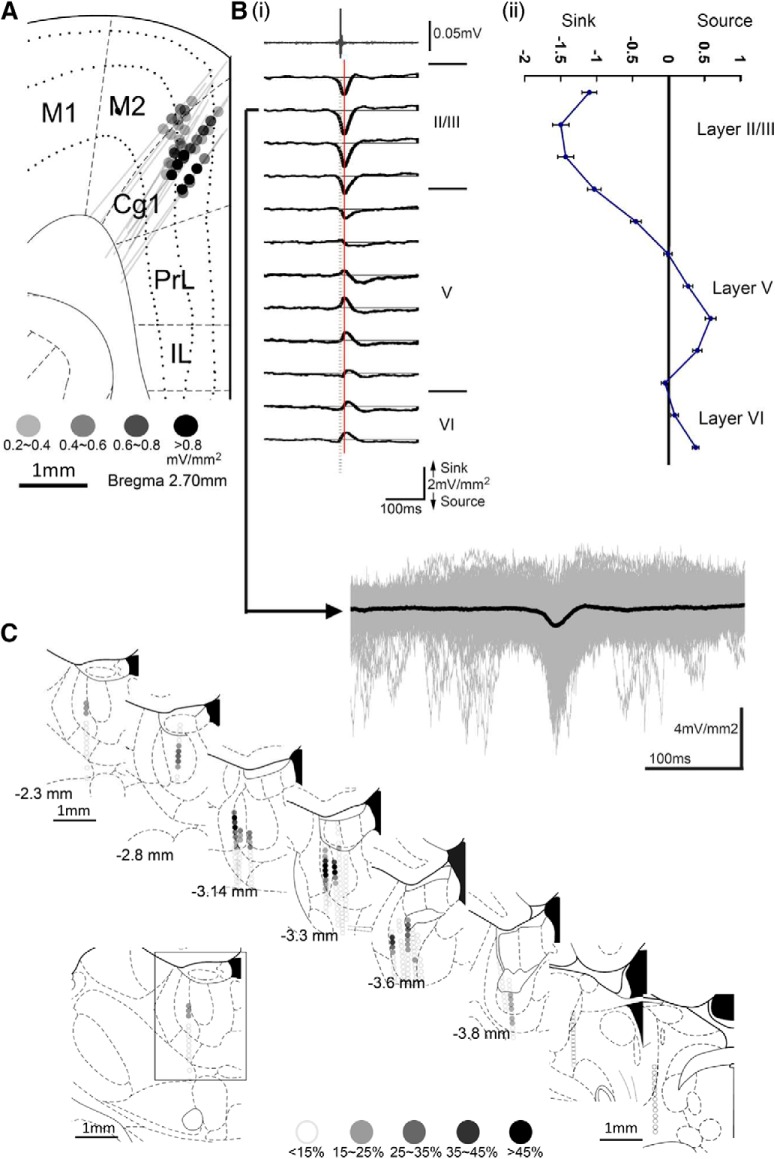
Figure 3.
Medial dorsal thalamic unit activity was followed by HCSs in the ACC. A, All recording tracks in the ACC. Colored dots represent the correlation between multiunit activity in the MD and HCSs in the ACC. Bi, Multiunit activity in the MD (top) could trigger a high-amplitude sink in layers II/III in the ACC. Arrow indicates one example of an averaged HCS overlaid with original multiple HCS sweeps. Bii, Profile of MD spikes that triggered HCSs in different layers of the ACC. C, All recorded tracks in the MT. Colored dots represent the correlation between multiunit activity in the MT and the amplitude of HCSs in the ACC. M1, Primary motor cortex; M2, secondary motor cortex; Cg1, cingulate cortex, area 1; PrL, prelimbic cortex; IL, infralimbic cortex.

