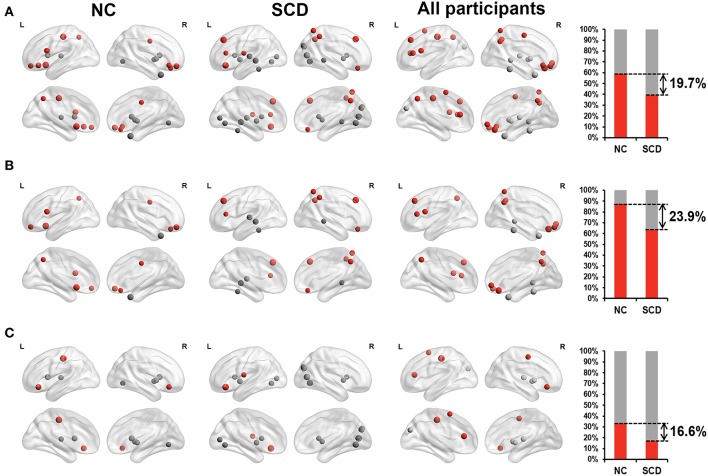
Figure 2.
Relationship between Z-scored degree centrality measured by static functional connectivity of brain regions and neuropsychological tests in NC group (the first column), SCD group (the second column) and all participants (the third column). The forth column showed the proportion of significant correlated regions (p < 0.05) located in anterior (red) cortical and other (gray) cortical regions in the two groups. The nodes covered by red are located in anterior cortical regions. By contrast, nodes covered by gray are located in posterior cortical regions or subcortical regions. The size of each node represents the absolute value of standardized ß. Nodes are located according to their centroid stereotaxic coordinates. (A) All the significant correlated regions (p < 0.05). (B) The regions in the default mode network. (C) The regions out of the default mode network.

