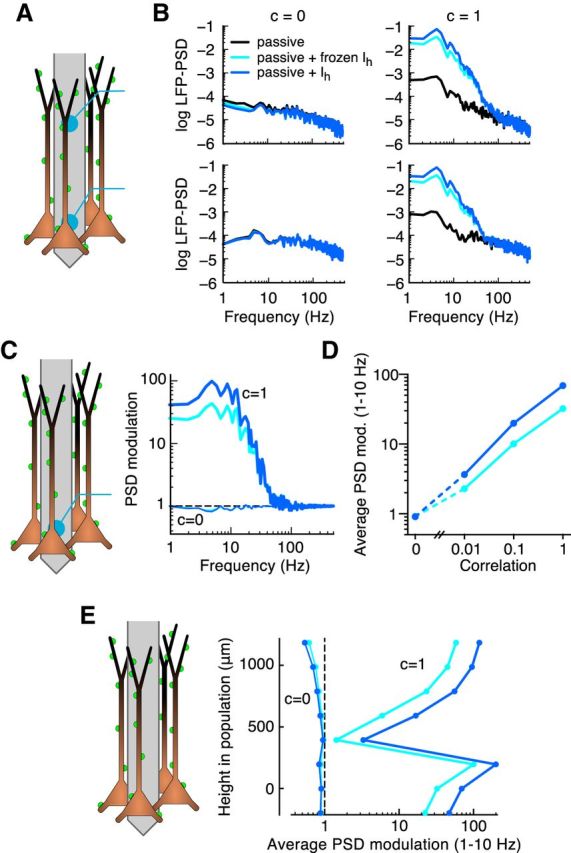
Figure 3.

Membrane conductance gradient amplifies the LFP signal for a population receiving correlated uniformly distributed synaptic input. A, B, LFP-PSD resulting from uniform synaptic input (A) with different levels of c between the synaptic inputs (B, columns) to a population of 10,000 cortical layer 5 pyramidal cells. Different curves correspond to the different cell models used in Figures 1 and 2. The LFP-PSDs are shown in log10 scale with units of μV2/Hz. C, PSD modulation, defined as the LFP-PSD from the passive + Ih model (blue curves) or passive + frozen Ih model (cyan curves), divided by the LFP-PSD from the passive model, for c = 0 (thin lines) or c = 1 (thick lines). D, Average of the PSD modulation between 1 and 10 Hz as a function of the synaptic input c value. E, Average of the PSD modulation between 1 and 10 Hz for different positions along the axis of the apical dendrites, in the middle of the population, for c = 0 (thin lines) or c = 1 (thick lines).
