Figure 8.
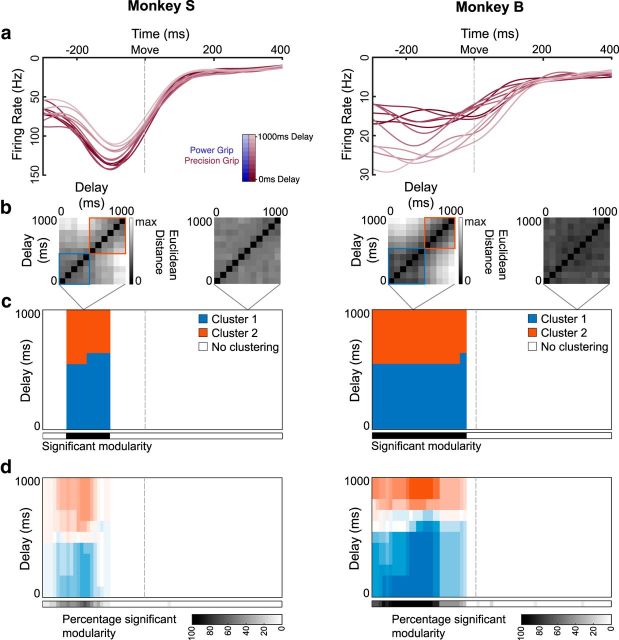
Clustering of movement-initiation activity in F5. a, Example individual unit activity in F5 over all linearly spaced delays (0–1000 ms) for an example dataset from each monkey (Sessions S5-Precision, B2-Precision), aligned to movement onset. b, Euclidean distance between all pairs of delays in the full neural space for two example time points of the example dataset, including identified clusters, using a clustering analysis that finds community structure (see Materials and Methods). c, Clusters identified in the distance matrices over time (in steps of 10 ms) for the example dataset. Black significance bar shows time points where the modularity statistic exceeded chance level (permutation test, p < 0.01). d, Same analysis as c averaged over all datasets and grip types (6 datasets × 2 grip types).

