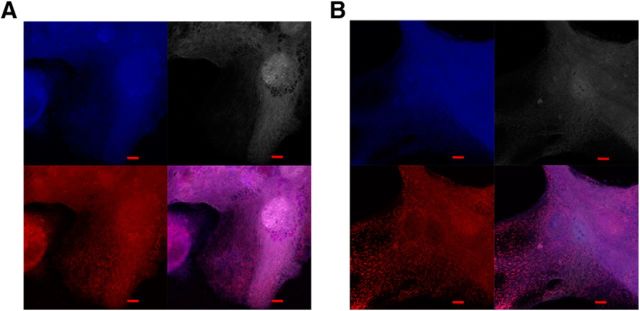
Figure 15.
Mitochondrial morphology in a primary neuron culture. A, Control cells display tubular mitochondrial morphology (bottom left, mitochondrial stain; bottom right, merged images). B, Mecr-KO cells were generated by transfection with lentivirus carrying Cre transgene and GFP. Mitochondria appear fragmented in those cells (bottom left, mitochondrial stain; bottom right, merged images). To determine transfection efficiency, both control and KO cell lines were expressing GFP. However, the GFP signal was very strong and consequently the images were processed with only red and blue channels. In each set of four images, clockwise from the top left image: anti-tubulin III stain (blue), cellular autofluorescence (pink/gray), all channels merged, and MitoTracker red only (red). Scale bar, 5 μm.

