Figure 2.

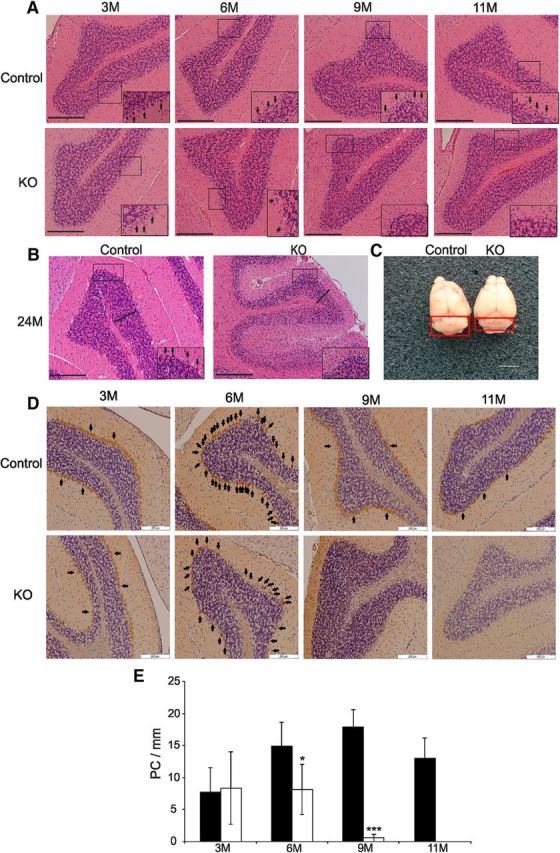
Microscopic and gross morphology of control and KO mouse cerebella. A, Progression of PC loss with age in hematoxylin-stained sections of cerebellum in KO mice. The insets show a magnified image of the boxed regions. Arrows point to PCs. Scale bar, 200 μm. B, Histology of cerebellum of a representative KO and control mouse at 2 years of age. The KO cerebella are completely devoid of PCs compared with the control mouse (inset: arrows point to PCs). Notice also the thinner granular cell layer (bold line) in the KO mouse. Scale bar, 200 μm. C, The cerebellum (boxed area) in a KO mouse appears atrophic (right) compared with that of a control mouse (left) at 2 years of age. Scale bar, 1 cm. D, Calbindin is used as a marker for PCs that are visualized by brown color. The panels demonstrate progressive loss of PCs in KO mice with increasing age. The PC layer displays discontinuity at 6 months and is absent from 9 months on. Arrows point to entire PC arrays in the panels depicting cerebellar sections of the 6-month-old mice to illustrate the extent of discontinuity in cerebellar sections of the mutant mice, and only to examples of PCs in the other panels. E, Quantitation of PC loss in mutant mice over time. At 6 months, a statistically significant difference in PC count (number of PCs per millimeter of border between the molecular/granular layers) in mice carrying the PC-specific Mecr KO allele can be found compared with controls and loss of PCs progresses with increasing age. The values are expressed as mean ± SD. *p < 0.05, ***p < 0.001.
