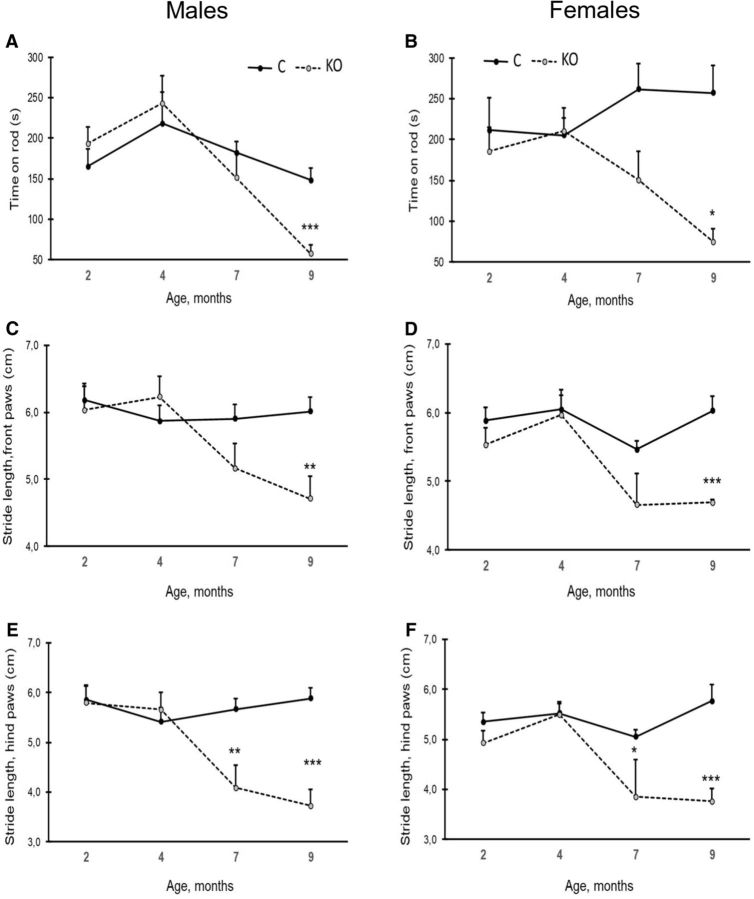
Figure 6.
Rotarod test and gait analysis for motor coordination and balance. A, B, Rotarod test data. The y-axis values indicate the time the mice were able to stay on the rotating rod up to a 6 min cutoff (males, A; females, B). C, D, Gait analysis during the follow-up from 2 to 9 months of age. Stride length of forepaws in males (C) and females (D). E, F, Gait analysis for stride length of hindpaws (males, E; females, F). Each analysis was done with six males and six females of different age group and genotype. Values are expressed as mean SEM. *p < 0.05, **p < 0.01, ***p < 0.001 (RM-ANOVA followed by LSD post hoc test).

