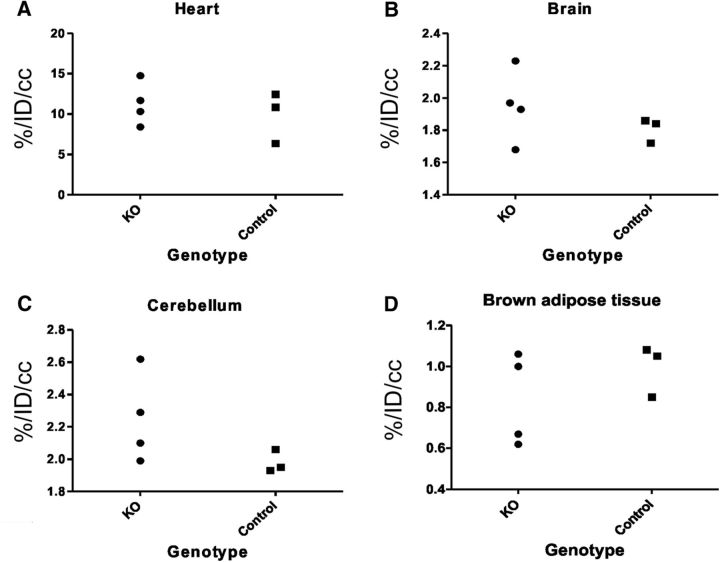
Figure 8.
FDG-PET analysis for evaluating glucose uptake in 6-month-old mice. The results of basal metabolic activities in heart (A), brain (B) (excluding cerebellum), cerebellum (C), and brown adipose tissue (D) measured as glucose uptake (y-axis) was found to be overlapping between KO mice and control mice, respectively. In cerebellum of KO mice, there was a trend toward increased glucose uptake. x-axis is the genotype; y-axis is the time–activity normalized to percentage of injected dose per cubic cm (%ID/cc).

