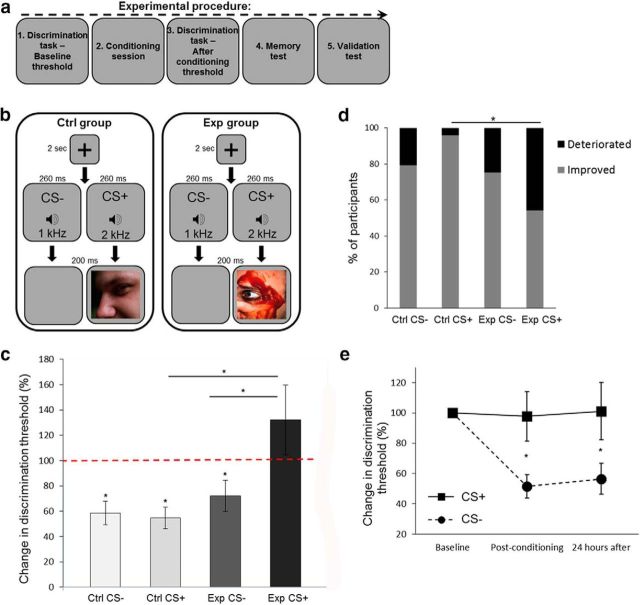
Figure 1.
The effect of visual aversive conditioning on auditory discrimination thresholds (Experiment 1). a, A general description of the experimental protocol. b, A schematic representation of one trial from the conditioning session of the auditory experiment (Experiment 1). High (2 kHz) or low (1 kHz) pure tones were counterbalanced as CS+ (followed by images) or CS− (followed by blank screens). Images were aversive in the experimental group (Exp) and neutral in the control group (Ctrl). c, Discrimination thresholds for tone frequency were tested before and after conditioning (experimental group, n = 24; control group, n = 24). Discrimination thresholds before conditioning were normalized to 100% (red dashed line), which was the reference for postconditioning thresholds. A decrease in threshold (improvement) was measured in both groups for the CS− tone, and in the control group for the CS+ tone. The experimental group showed a deterioration in performance for the CS+ tone (paired with aversive images), compared with its results for the CS− tone, and to the CS+ tone in the control group, with a CS × group interaction effect. d, More experimental group participants deteriorated in discrimination thresholds for the CS+ tone compared with the control group. The gray bars show the percentage of participants for whom the postconditioning threshold was lower than the preconditioning threshold (improvement), and the black bars show the fraction of participants for whom the postconditioning threshold was higher (deterioration). e, Change in discrimination thresholds (compared with baseline) for the aversive CS+ (solid line) and the CS− (dashed line) of the experimental group (n = 19), immediately after conditioning and 24 h later. The stability of the thresholds persisted after 24 h. *p < 0.05, see text for details regarding specific significance values.

