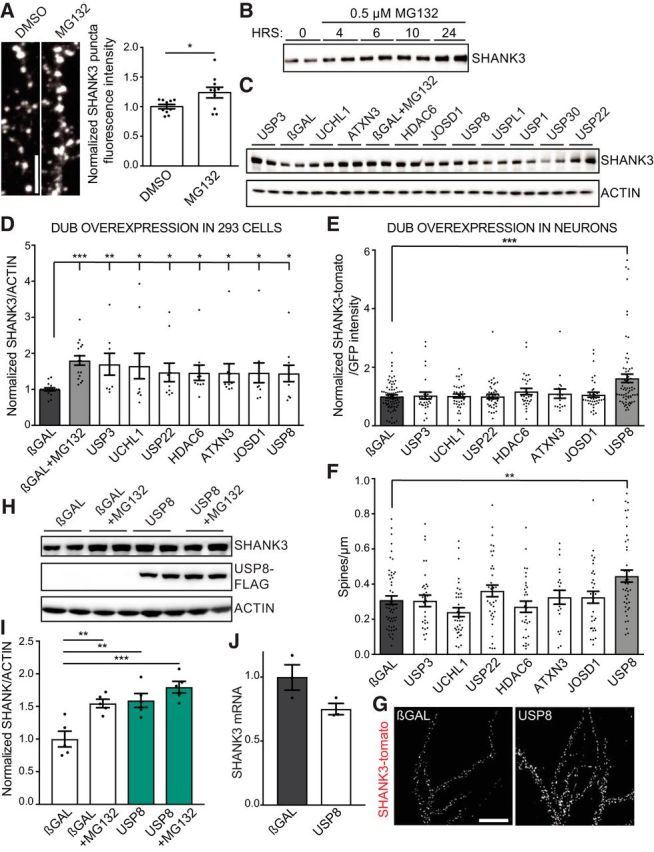
Figure 1.

Screen for deubiquitinating enzymes that modulate SHANK3. A, DIV21 dissociated rat cortical neurons were treated for 3 h with DMSO (vehicle) or 1 μm MG132 (proteasome inhibitor) and were stained for endogenous SHANK3. SHANK3 immunofluorescence intensity increases with MG132 treatment. Scale bar, 5 μm. n = 10 images; 1 culture; Student's t test, p = 0.0248. B, Stable human SHANK3-expressing cell line shows increase in SHANK3 protein levels upon proteasome inhibition with 0.5 μm MG132 over time. C, Representative Western blots of SHANK3 and actin after overexpression of individual FLAG-tagged DUBs from a human cDNA library for 76 h in stable SHANK3-expressing cells. Blots show βGAL control, βGAL with MG132 treatment as a positive control, the seven DUBs that increase SHANK3 protein levels, and three control DUBs that do not show a difference with control, USPL1, USP1, USP30. D, Quantification of SHANK3/ACTIN intensity reveals seven DUBs with statistically significant increases compared with βGAL control. βGAL transfected cells treated with MG132 was used as a positive control. n = 5 biological replicates with n = 2–3 technical replicates per experiment. One-way ANOVA: F = 2.316, p < 0.0001; post hoc Student's t test, βGAL vs MG132, p = 0.0001; βGAL vs USP3, p = 0.0033; βGAL vs USP22, p = 0.0279; βGAL vs HDAC6, p = 0.0112; βGAL vs ATXN3, p = 0.0332; βGAL vs UCHL1, p = 0.0249; βGAL vs JOSD1, p = 0.0427; βGAL vs USP8, p = 0.021. E–G, DIV15 rat hippocampal neurons were transfected with GFP, SHANK3-TdTomato, and individual FLAG-tagged DUBs (as indicated) for 24 h. Confocal microscope images were obtained by observers blinded to transfection conditions, and collapsed z-stack images were quantified by a single blinded experimenter. E, F, Overexpression of USP8 results in a significant increase in SHANK3-TdTomato/GFP intensity (E) and dendritic spine density (F). n = 3–5 independent cultures, ∼10 neurons quantified for each condition per culture. Intensity: one-way ANOVA: F = 3.093, p = 0.0146; post hoc Student's t test: βGAL vs USP8, p = 0.0002; spine density: one-way ANOVA: F = 4.595, p = 0.0011; post hoc Student's t test: βGAL vs USP8, p = 0.0068. G, Representative images. Scale bar, 20 μm. H, I, Overexpression of USP8 in combination with 1 μm MG132 treatment (USP8+MG132) for 24 h does not have an additive effect compared with USP8 or MG132 alone. One-way ANOVA: F = 12.18, p = 0.0002; post hoc Student's t test: βGAL vs βGAL + MG132, p = 0.004; βGAL vs USP8, p = 0.0061; βGAL vs USP8 + MG132, p = 0.0007. J, Quantification by TaqMan qPCR of total SHANK3 mRNA relative to HPRT1 mRNA in stable human-SHANK3-expressing HEK293 cells following the overexpression of either βGAL or USP8. Student's t test, p = 0.077. *p < 0.05, **p < 0.01, ***p < 0.001.
