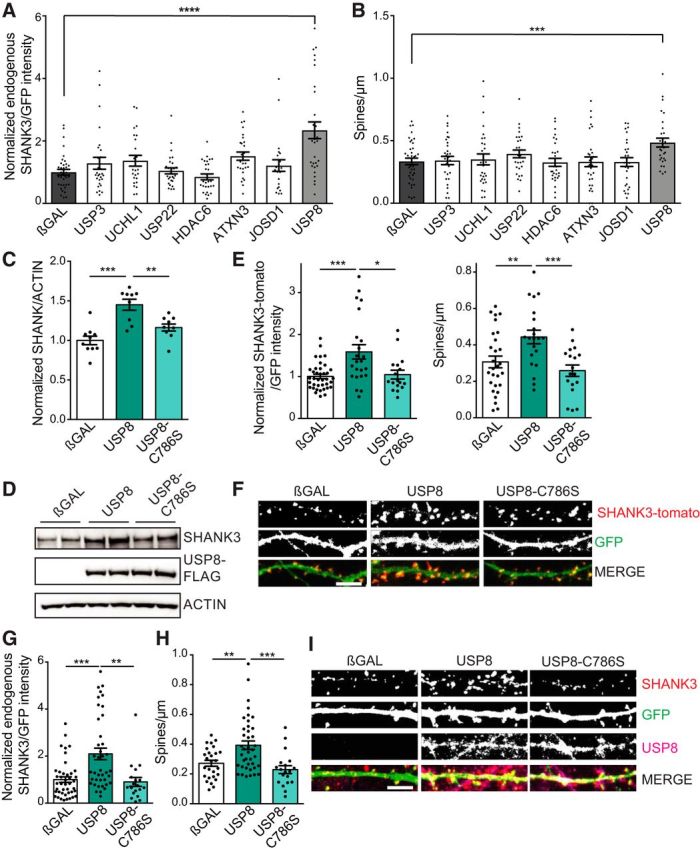
Figure 2.

Overexpression of deubiquitinating enzymes in dissociated neurons. A, B, DIV15 rat hippocampal neurons were transfected with GFP and individual FLAG-tagged DUBs (as indicated) for 24 h. Confocal microscope images were obtained by an observer blinded to transfection conditions, and collapsed z-stack images were quantified by a single blinded experimenter. A, B, Overexpression of USP8 results in a significant increase in endogenous SHANK3/GFP intensity (A) and dendritic spine density (B). n = 3–5 independent cultures; ∼10 neurons quantified for each condition per culture. Intensity: one-way ANOVA: F = 8.605, p < 0.0001; post hoc Student's t test: βGAL vs USP8, p < 0.0001; spine density: one-way ANOVA: F = 2.478, p = 0.018; post hoc Student's t test: βGAL vs USP8, p = 0.0008. C, D, Overexpression of catalytically dead mutant USP8–C786S in the human SHANK3-expressing stable cells does not increase SHANK3 protein levels like WT USP8. n = 9 independent transfections per construct. One-way ANOVA: F = 16.28, p < 0.0001; post hoc Student's t test: βGAL vs USP8, p < 0.0001; βGAL vs C786S, p = 0.1062; USP8 vs C786S, p = 0.0022. E, F, Overexpression of WT USP8 in DIV15 rat hippocampal cultures results in an increase in SHANK3-TdTomato intensity and dendritic spine density compared with βGAL control or USP8–C786S (enzyme dead). n = 3 independent cultures, ∼10 neurons/culture. Intensity: one-way ANOVA: F = 9.338, p = 0.0002; post hoc Student's t test: βGAL vs USP8, p = 0.0002; βGAL vs C786S: p = 0.6652; USP8 vs C786S, p = 0.0176; spine density: one-way ANOVA: F = 7.175, p = 0.0015; post hoc Student's t test: βGAL vs USP8, p = 0.0079; βGAL vs C786S, p = 0.3168; USP8 vs C786S, p = 0.0007. F, Representative images. Scale bar, 5 μm. G–I, DIV15 rat hippocampal neurons were transfected with GFP and USP8 or USP8–C786S (enzyme dead) for 24 h and stained for endogenous SHANK3. Confocal microscope images were obtained by observers blinded to transfection conditions and collapsed z-stack images were quantified by a single blinded experimenter. G, H, Overexpression of USP8, but not USP8–C786S, results in an increase in immunofluorescence intensity of endogenous SHANK3 clusters (G) and in dendritic spine density (H) compared with control. n = 3 independent cultures, ∼10 neurons quantified for each condition per culture. Intensity: one-way ANOVA: F = 11.46, p < 0.0001; post hoc Student's t test: βGAL vs USP8, p = 0.0001; βGAL vs C786S, p = 0.6596; USP8 vs C786S, p = 0.0027; spine density: one-way ANOVA: F = 9.888, p = 0.0001; post hoc Student's t test: βGAL vs USP8, p = 0.0026; βGAL vs C786S, p = 0.2037; USP8 vs C786S, p = 0.0007. I, Representative images. Scale bar, 5 μm. *p < 0.05, **p < 0.01, ***p < 0.001, ****p < 0.0001.
