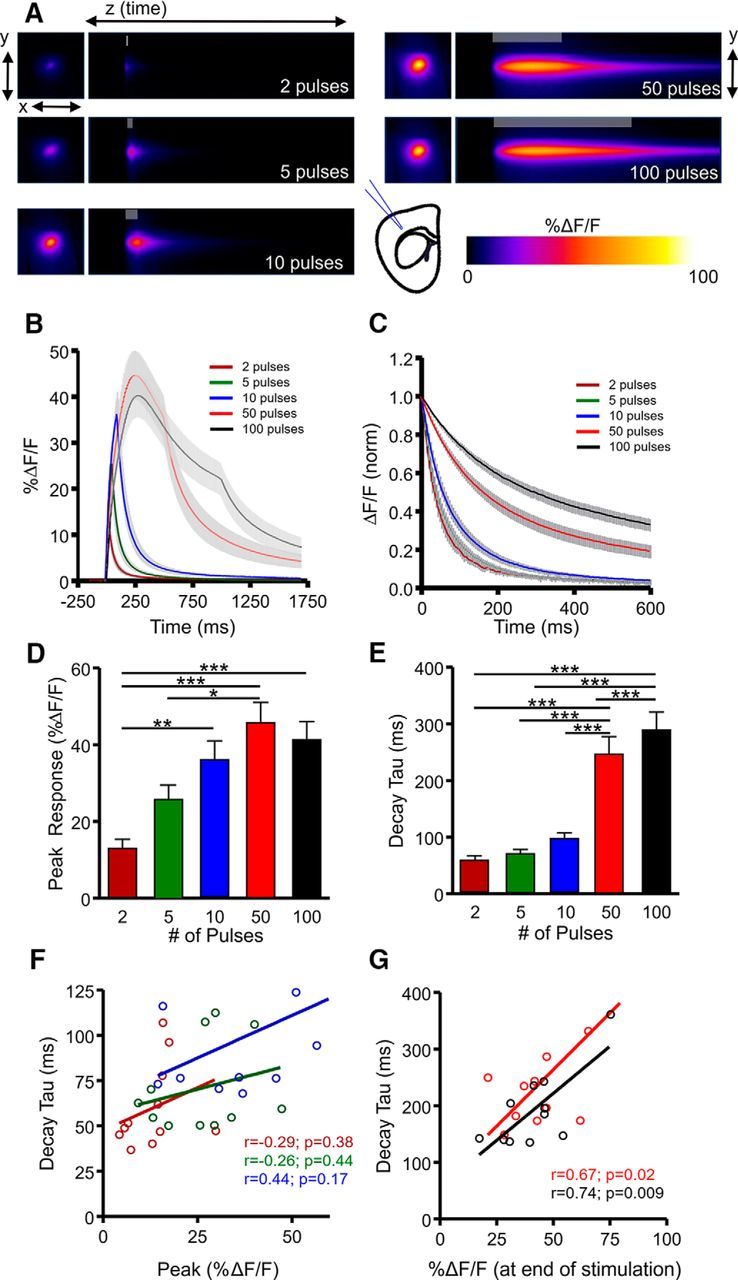
Figure 2.

Characterization of extracellular glutamate dynamics in the cortex. A, Representative heatmaps of iGluSnFR responses after afferent stimulation (100 Hz). Peak responses are shown in the x–y plane (image size, 2 × 2 mm), and the y–z (time) plots show the kinetics of the response at a defined x-coordinate adjacent to the site of stimulation (image represents 2 s). The gray shaded area within the images denotes the onset and duration of afferent stimulation. B, Mean (±SEM) iGluSnFR response profiles to 2, 5, 10, 50, or 100 pulses of afferent stimulation at 100 Hz. C, Mean responses (±SEM) from B that were normalized to the peak value at the end of the stimulation. D–E, Grouped data showing mean (±SEM) iGluSnFR response peak (D) and decay tau (E). RM ANOVA with Tukey's post hoc results are indicated by *p < 0.05 and ***p < 0.001. F–G, Decay and %ΔF/F correlation of the iGluSnFR responses with a short burst of activity (F) and longer trains of high-frequency stimulation (G). **p < 0.01.
