
Figure 4.
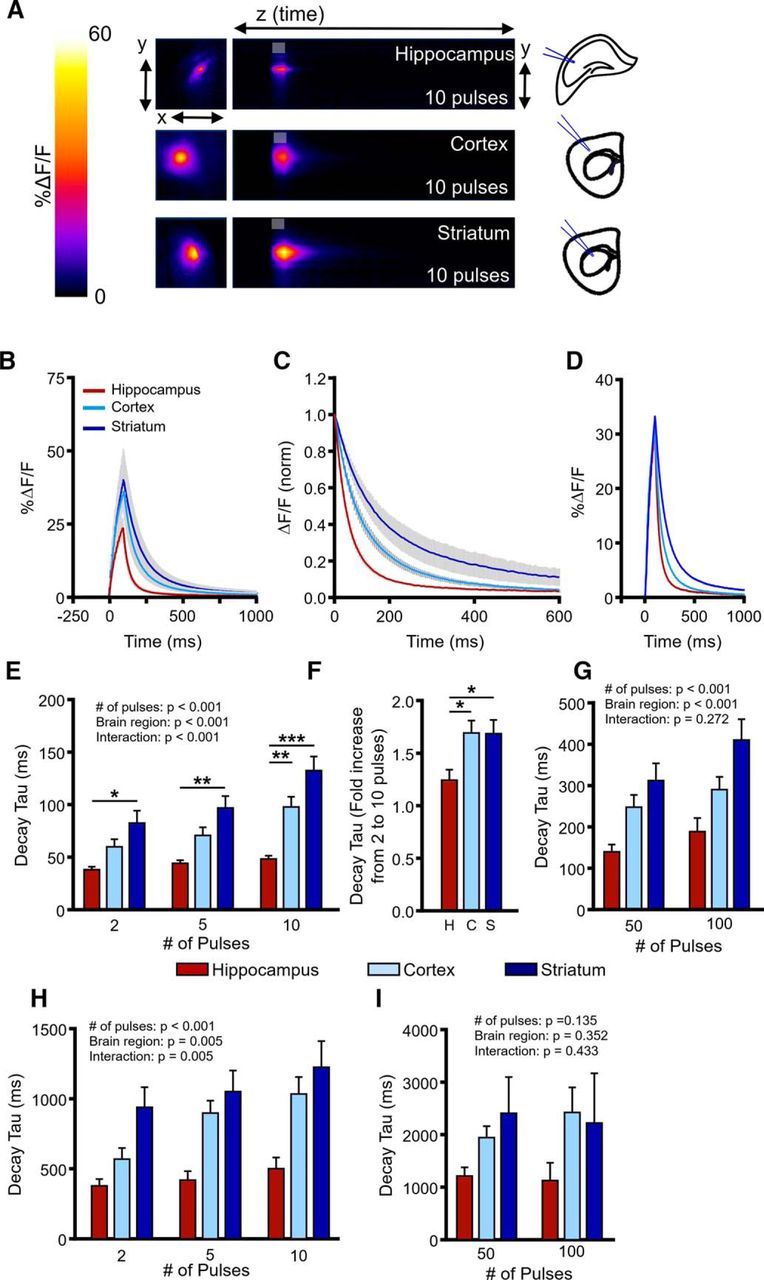
Regional differences in glutamate clearance capacity. A, Representative heatmaps of iGluSnFR responses in the hippocampus, cortex, and striatum after afferent stimulation (10 pulses at 100 Hz). Peak responses are shown in the x–y plane (image size, 2 × 2 mm), and the y–z (time) plots show the kinetics of the response at a defined x-coordinate adjacent to the site of stimulation (image represents 2 s). The gray shaded area within the images denotes the onset and duration of afferent stimulation. B, Mean (±SEM) iGluSnFR responses in the hippocampus, cortex, and striatum to 10 pulses at 100 Hz. C, Mean responses (±SEM) from B that were normalized to the peak value at the end of the stimulation. D, Raw responses (±SEM) from B were selected so that the average peak value was comparable between the three brain regions. E–G, Regional comparison of mean (±SEM) iGluSnFR decay tau values showing fastest glutamate clearance rates in the hippocampus, intermediate clearance rates in the cortex, and slow clearance rates in the striatum, for both shorter bursts of activity (E, F) and longer trains of high-frequency stimulation (G). H–I, Mean (±SEM) iGluSnFR decay tau values in the hippocampus, cortex, and striatum during glutamate transporter blockade with TBOA (100 μm) to quantify relative glutamate diffusion rates. *p < 0.05, **p < 0.01, ***p < 0.001.