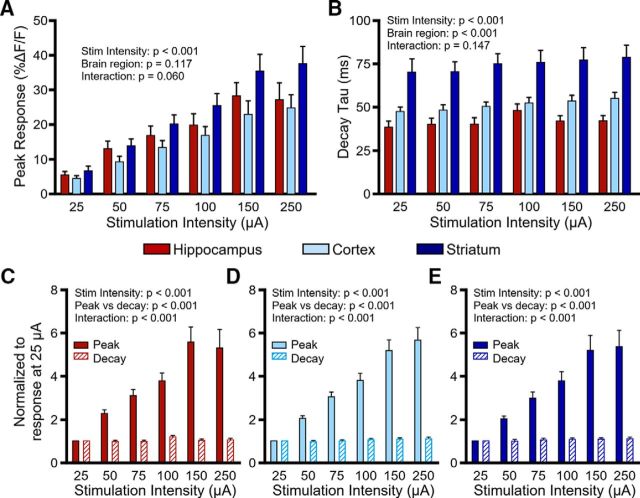
Figure 5.
Effect of stimulus intensity on extracellular glutamate dynamics. A, Mean (±SEM) iGluSnFR peaks in the hippocampus, cortex, and striatum in response to increasing the stimulus intensity (5 pulses, 100 Hz) from 25 to 250 μA. B, Mean (±SEM) iGluSnFR decay tau values in the hippocampus, cortex, and striatum in response to increasing the stimulus intensity (5 pulses, 100 Hz) from 25 to 250 μA. C–E, Comparison of the effect of stimulus intensity on iGluSnFR peak (solid bars) and decay tau (hatched bars) for the hippocampus (C), cortex (D), and striatum (E). Data were normalized to the response at 25 μA. All p values were obtained by two-way RM ANOVA.

