Figure 8.

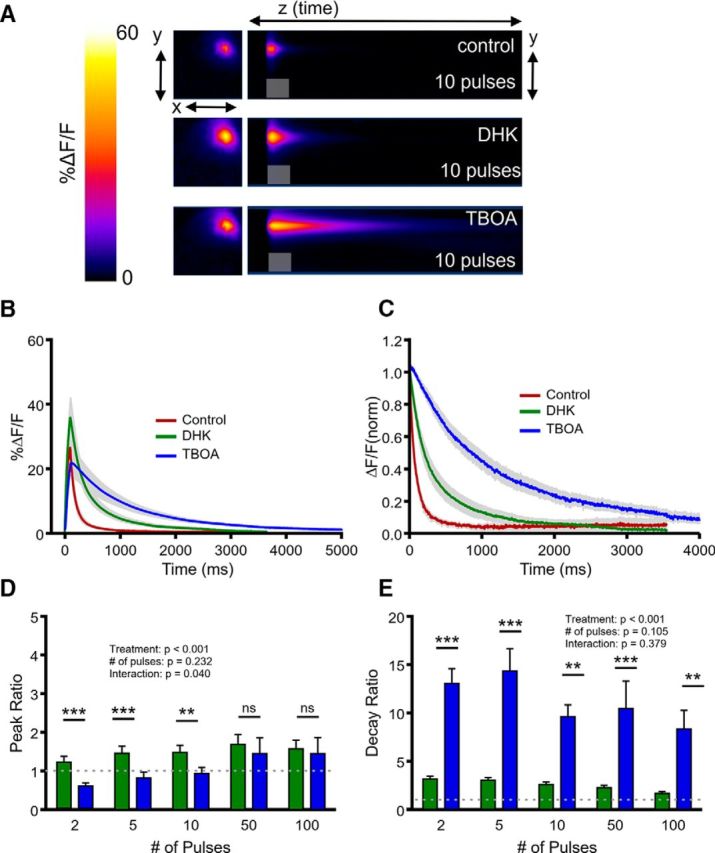
Comparison of the effects of selective GLT-1 inhibition and nonselective transporter inhibition on glutamate dynamics in the striatum. A, Representative heatmaps of striatal iGluSnFR responses after afferent stimulation (10 pulses at 100 Hz) in control conditions and after GLT-1 blockade with DHK (300 μm) and nonselective glutamate transporter blockade with TBOA (100 μm). Peak responses are shown in the x–y plane (image size, 2 × 2 mm), and the y–z (time) plots show the kinetics of the response at a defined x-coordinate adjacent to the site of stimulation (image represents 2 s). The gray shaded area within the images denotes the onset and duration of afferent stimulation. B, Mean (±SEM) iGluSnFR response profiles to 10 pulses of afferent stimulation at 100 Hz in control, DHK and TBOA conditions. C, Mean responses (±SEM) from B that were normalized to the peak value at the end of the stimulation. D–E, Grouped data showing mean (±SEM) DHK and TBOA peak ratios (D) and decay ratios (E) over a variety of stimulation paradigms. Peak and decay ratios indicate the fold effect of drug treatment over control levels. Two-way RM ANOVA with Bonferroni's post hoc results are indicated by **p < 0.01 and ***p < 0.001.
