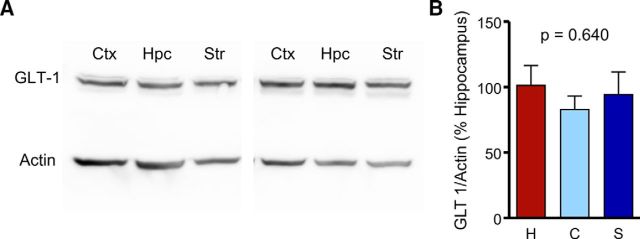
Figure 9.
GLT-1 expression levels are similar in the adult hippocampus, cortex, and striatum. A, Representative Western blot of GLT-1 expression in the cortex (Ctx), hippocampus (Hpc), and striatum (Str). B, Quantification of mean (±SEM) GLT-1 expression in the cortex (C), hippocampus (H), and striatum (S). ANOVA, p = 0.640.

