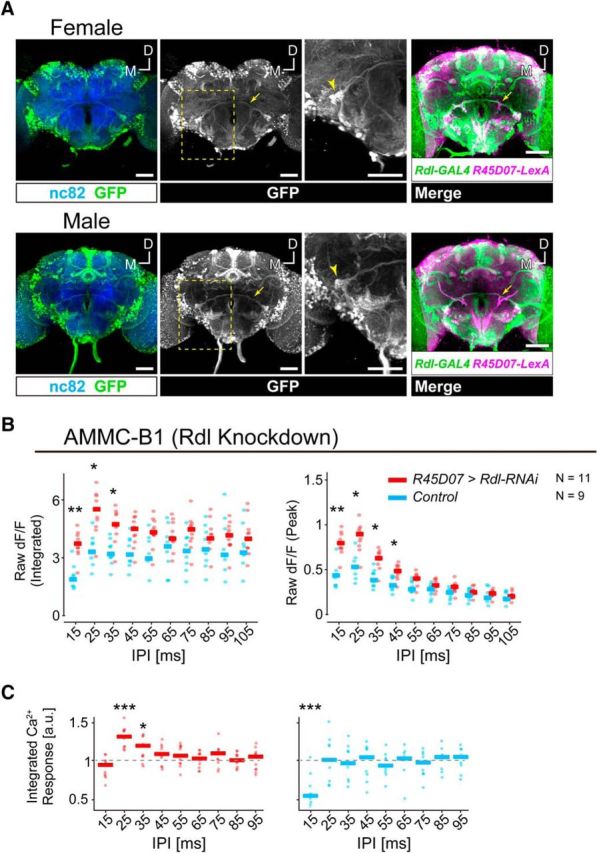
Figure 2.

AMMC-B1 neurons receive GABAergic inputs via GABAA receptors. A, Expression pattern of the Rdl-GAL4 driver in female and male brains. GFP expressed by Rdl-GAL4 driver (green) are shown. Left, Blue signals show neuropil visualized using the nc82 antibody. Middle, White signals show the labeled neurons visualized using anti-GFP antibodies. The brain is the same as that shown on the left. Arrows indicate AMMC-B1 neurons, which project from the AMMC zone B to the wedge (WED). Yellow dotted frame indicates the position for a magnified view. Arrowheads in the magnified view indicate the AMMC-B1 neurons innervating the WED. Right, Coregistration of Rdl-GAL4 and R45D07-LexA expressions. Overlay of registered R45D07-LexA (magenta) and Rdl-GAL4 (green) brains visualized an overlap in AMMC-B1 neurons (arrows). Stacked optical sections are shown. Scale bars, 50 μm. D, Dorsal; M, medial. B, Raw ΔF/F responses of AMMC-B1 neurons in Rdl knock-down (red) and control (light blue) flies. C, Normalized Ca2+ responses of AMMC-B1 neurons in Rdl knock-down (red) and control (light blue) flies. Ca2+ response is normalized by the response to a 105 ms IPI (reference stimulus) to compare the response patterns. Ca2+ responses are displayed as in Figure 1. Gray dashed lines in C indicate the response to the reference stimulus. Number of animals tested is denoted in B. The data of AMMC-B1 (control) are the same as those shown in Figure 1D. Asterisks indicate statistical differences: *p < 0.05; **p < 0.01; ***p < 0.001. a.u., Arbitrary unit. For the time traces of raw ΔF/F responses of AMMC-B1 neurons in Rdl knock-down flies, see Figure 2-1.
