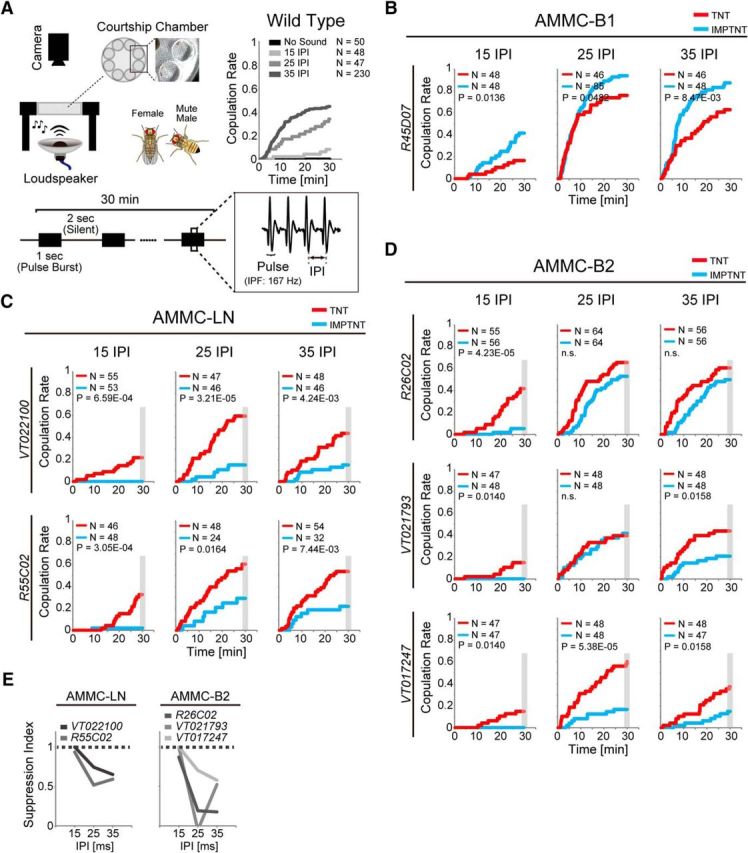
Figure 6.

GABAergic local interneurons suppress the female's response to song. A, Female receptivity assay. Left, Top, Experimental setup. Bottom, Artificial pulse song. Songs with 15, 25, and 35 ms IPIs were used. Right, Top, Copulation rate of wild-type fly pairs during playback of artificial pulse songs. Cumulative copulation success rate as a function of time is shown. Inset shows the number of fly pairs. B, Copulation rate of females in which AMMC-B1 neurons were silenced. An artificial pulse song was played during the assay. Experimental groups expressed TNT (red), whereas control groups expressed IMPTNT (light blue), in AMMC-B1 neurons of females. Wild-type (Canton-S) male flies were used as partners for the females. The number of fly pairs and p-value are shown in each panel. C, Copulation rate of females in which AMMC-LN neurons were silenced. D, Copulation rate of females in which AMMC-B2 neurons were silenced. E, Suppression index. Behavioral suppression of the copulation rate by each GABAergic local interneuron is plotted as a function of IPI. The copulation rate at 30 min (gray shaded period in C and D) was used to calculate the suppression index (1 − CRIMPTNT/CRTNT). n.s., Not significant. For the labeling pattern of GAL4 driver lines, see Figure 6-1. For the comparison of copulation rates between control flies, see Figure 6-2.
