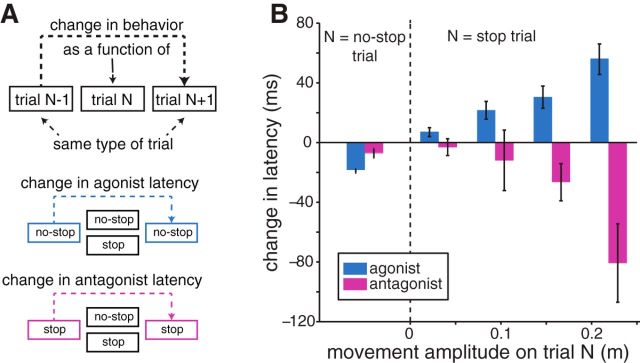
Figure 10.
Triplet analysis. A, Graphical depiction of the logic of the analysis, wherein the change in the agonist or antagonist latency across the n − 1 and n + 1 trial is assessed as a function of the intervening trial (e.g., whether trial n was a stop or no-stop trial). B, When the intervening trial was a no-stop trial (left of dashed line), both agonist latency (blue) and antagonist latency (magenta) decreased. When the intervening trial was a stop trial (right of dashed line), agonist latency increased but antagonist latency decreased as a function of movement amplitude on the intervening trial.

