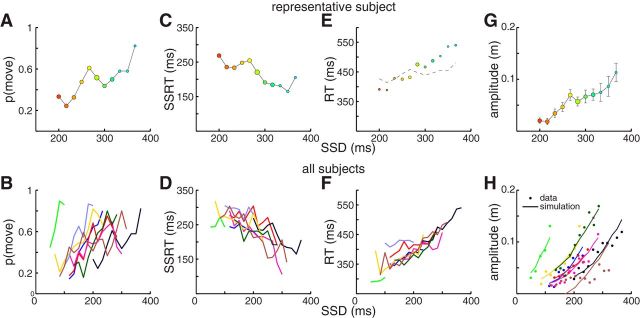
Figure 5.
Variation in countermanding performance as a function of SSD. Top row indicates data from the representative subject (color codes as in Fig. 3; disc radius proportional to number of samples). Bottom row indicates data across all subjects (color codes as in Fig. 4). A, B, Inhibition function, expressing movement probability versus SSD. C, D, SSRTs estimated via the integration method are negatively correlated with SSD. E, F, RTs on noncanceled trials increase as a function of SSD, although as shown in E, such increases are greater than that predicted by the independent race model (thin line). G, H, The amplitude of noncanceled trials increases with SSD; this increase was well predicted by a bootstrapping simulation of movement amplitude based on independent sampling of agonist and antagonist onsets (see Materials and Methods). H, Lines indicate predictions of simulations.

