Figure 1.

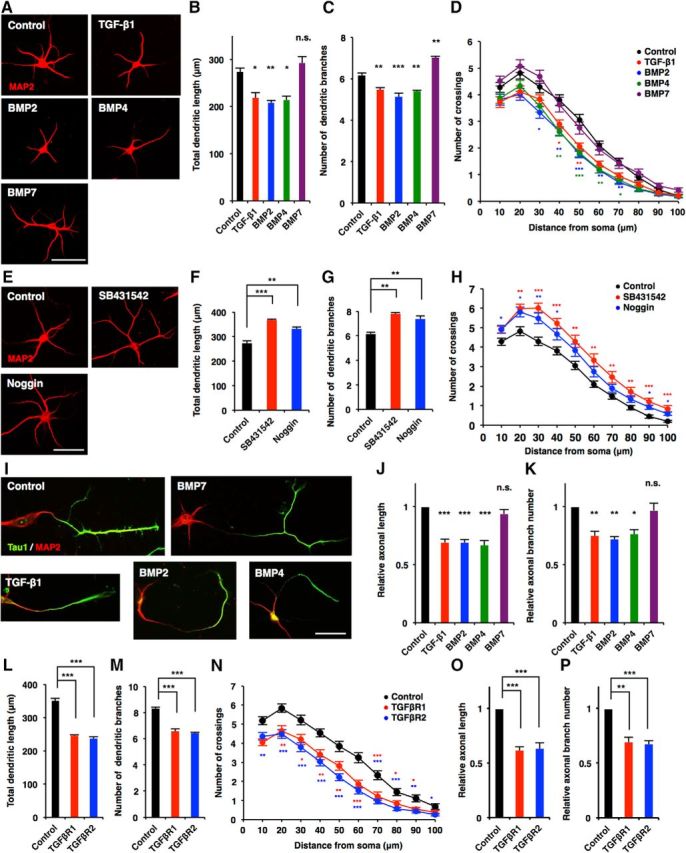
TGF-β family signals negatively regulate neuronal development in hippocampal neurons. A, Representative images of MAP2 (red) staining of 6DIV hippocampal neurons treated with BSA (control), TGF-β1, BMP2, BMP4, and BMP7. Scale bar, 50 μm. B, C, Quantification of total dendritic length (B) and branch numbers (C) of A. D, Quantification of dendrite complexity by Sholl analysis of 3DIV hippocampal neurons treated with BSA, TGF-β1, BMP2, BMP4, and BMP7. E, Representative images of MAP2 (red) staining of 6DIV hippocampal neurons treated with BSA (control), SB431542, and Noggin. Scale bar, 50 μm. F, G, Quantification of total dendritic length (F) and branch numbers (G) in E. H, Quantification of dendrite complexity by Sholl analysis of 6DIV hippocampal neurons treated with BSA, SB431542, and Noggin. I, Representative images of Tau1 (green) and MAP2 (red) staining of 3DIV hippocampal neurons treated with BSA, TGF-β1, BMP2, BMP4, and BMP7. Scale bar, 50 μm. J, K, Quantification of total axon length (J) and axon branch numbers (K) of 3DIV hippocampal neurons treated with BSA, TGF-β1, BMP2, BMP4, and BMP7 immunostained with antibodies against Tau1. Total length and branch numbers of Tau1-positive axons were measured. L, M, Quantification of total dendritic length (L) and branch numbers (M) of 6DIV hippocampal neurons infected with lentiviruses expressing GFP alone (control) or GFP together with TGFβR1 or TGFβR2. N, Quantification of dendrite complexity by Sholl analysis of 6DIV hippocampal neurons infected with lentiviruses expressing TGFβR1 or TGFβR2. O, P, Quantification of total axon length (O) and axon branch numbers (P) of 3DIV hippocampal neurons infected with lentiviruses expressing TGFβR1 or TGFβR2. Data are presented as the mean ± SEM. p > 0.05 (n.s.); *p < 0.05, **p < 0.01, ***p < 0.001 by one-way ANOVA, Tukey's post-test. N = 3 independent experiments; at least 50 neurons were analyzed in each experiment.
