Figure 12.
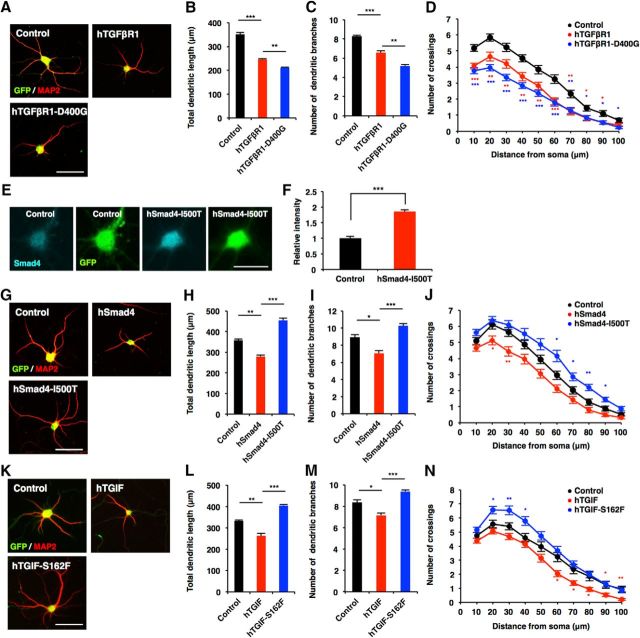
Mutations in canonical TGF-β signaling factors disrupt neuronal morphogenesis. A, Representative images of GFP (green) and MAP2 (red) staining of 6DIV hippocampal neurons infected with lentiviruses expressing hTGFβR1 or hTGFβR1-D400G. Scale bar, 50 μm. B, C, Quantification of total dendritic length (B) and branch numbers (C) of 6DIV hippocampal neurons infected with lentiviruses expressing hTGFβR1 or hTGFβR1-D400G. D, Quantification of dendrite complexity by Sholl analysis of 6DIV hippocampal neurons infected with lentiviruses expressing hTGFβR1 or hTGFβR1-D400G. E, Representative images of Smad4 (cyan) and GFP (green) staining of 6DIV hippocampal neurons infected with lentivirus expressing hSmad4-I500T. Scale bar, 30 μm. F, Quantification of hSmad4-I500T expression. hSmad4-I500T signal intensity in neuronal soma infected with control virus was divided by GFP signal intensity, and this value was used for normalization of the value obtained with hSmad4-I500T-expressing, virus-infected cells. G, Representative images of GFP and MAP2 staining of 6DIV hippocampal neurons infected with lentiviruses expressing hSmad4 or hSmad4-I500T. Scale bar, 50 μm. H, I, Quantification of total dendritic length (H) and branch numbers (I) of 6DIV hippocampal neurons infected with lentiviruses expressing hSmad4 or hSmad4-I500T. J, Quantification of dendrite complexity by Sholl analysis of 6DIV hippocampal neurons infected with lentiviruses expressing hSmad4 or hSmad4-I500T. K, Representative images of GFP and MAP2 staining of 6DIV hippocampal neurons infected with lentiviruses expressing hTGIF or hTGIF-S162F. Scale bar, 50 μm. L, M, Quantification of total dendritic length (L) and branch numbers (M) of 6DIV hippocampal neurons infected with lentiviruses expressing hTGIF or hTGIF-S162F. N, Quantification of dendrite complexity by Sholl analysis of 6DIV hippocampal neurons infected with lentiviruses expressing hTGIF or hTGIF-S162F. Data are presented as the mean ± SEM. F, ***p < 0.001 by Student's t test. B, C, H, I, L, M, *p < 0.05, **p < 0.01, ***p < 0.001 by one-way ANOVA, Tukey's post-test. N = 3 independent experiments; at least 50 neurons were analyzed in each experiment.

