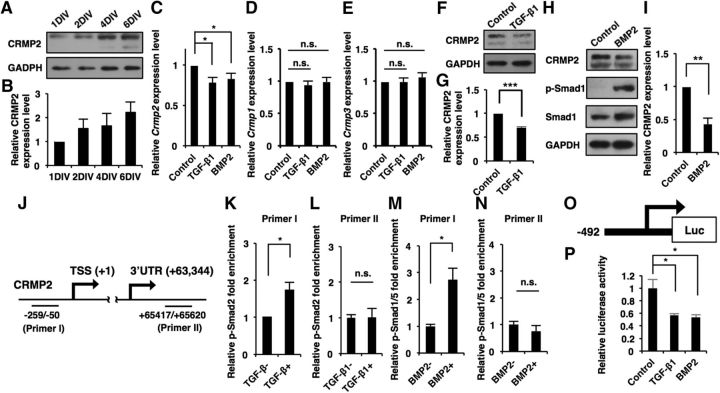
Figure 5.
Canonical TGF-β/BMP signaling represses expression of CRMP2 at the transcription level in hippocampal neurons. A, Western blot analysis of CRMP2 expression in developing cultured hippocampal neurons at 1DIV, 2DIV, 4DIV, and 6DIV. B, Quantification of CRMP2 expression levels in A. C–E, qRT-PCR analysis of Crmp2, Crmp1, and Crmp3 levels in cultured hippocampal neurons. The cells were treated with TGF-β1 or BMP2 for 12 h. F, H, Western blot analysis of CRMP2 expression in cultured hippocampal neurons. The cells were treated with TGF-β1 or BMP2 for 12 h. G, I, Quantification of CRMP2 expression levels in F and H. J, Diagram of the Crmp2 promoter and 3′UTR region. PrimerI and primerII recognize the Crmp2 promoter and 3′UTR region, respectively. K–N, ChIP-qPCR analysis of p-Smad2 (K, L) or p-Smad1/5 (M, N) binding to the Crmp2 promoter or 3′UTR in cultured hippocampal neurons. The cells were treated with TGF-β1 or BMP2 for 1 h. O, Diagram of the luciferase construct containing the Crmp2 promoter region and TSS. P, Quantification of luciferase activity of hippocampal neurons treated with BSA, TGF-β1, and BMP2, and transfected with the luciferase construct. Data are presented as the mean ± SEM. G, K–N, *p < 0.05, **p < 0.01, ***p < 0.001 by Student's t test. p > 0.05 (n.s.). C–E, P, *p < 0.05 by one-way ANOVA, Tukey's post-test. N = 3 independent experiments; at least 50 neurons were analyzed in each experiment.

