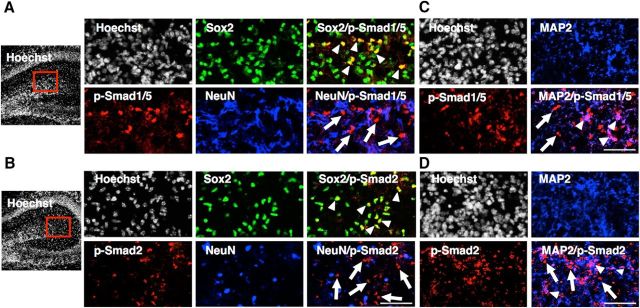
Figure 8.
Activation of Smads gradually decreases during neuronal differentiation and maturation in vivo. A, B, Representative images of Sox2 (green), NeuN (blue) and p-Smad1/5 (red; A) or p-Smad2 (red; B) staining of P1 hippocampus. The boxed areas are enlarged in the right panels. Arrowheads, Representative cells double-positive for Sox2 and p-Smad1/5 (A) or Sox2 and p-Smad2 (B); arrows, p-Smad1/5 (A) or p-Smad2 (B) single-positive cells. p-Smads and NeuN signals are mutually exclusive. Scale bar, 100 μm. C, D, Representative images of MAP2 (blue) and p-Smad1/5 (red; C) or p-Smad2 (red; D) staining of P1 hippocampus. Arrowheads, Representative cells double-positive for MAP2 and p-Smad1/5 (C) or Sox2 and p-Smad2 (D); arrows, p-Smad1/5 (C) or p-Smad2 (D) single-positive cells. Subpopulations of MAP2-positive cells are p-Smad1/5-positive or p-Smad2-positive. Scale bar, 100 μm.

