Figure 11.

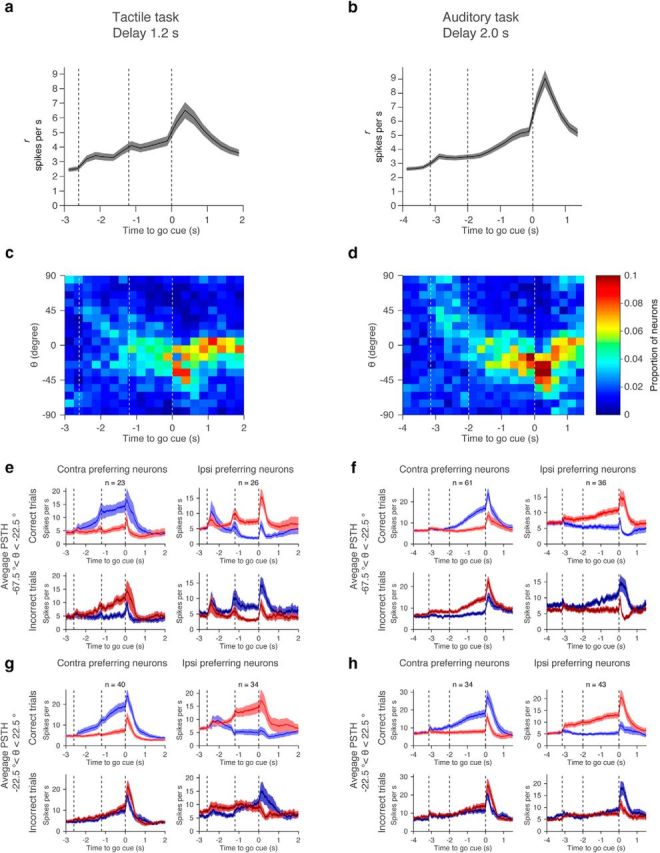
Coding of selectivity over time. a, b, Amplitude of selectivity (r) over time. Mean and SEM (1000 permutations). c, d, Histogram of θ over time. Bin size: 10° for θ and 250 ms for time. Mean of 1000 permutation. To calculate θ, we selected cells with r > 2 (Fig. 10a,b). Because of the ramping, the number of analyzed neurons increased during the delay epoch. e, f, Grand mean PSTH of cells coding motor output (−67.5° < θ < −22.5°). Shadow, SEM (bootstrap). g, h, Grand mean PSTH of cells with mixed-selectivity coding (−22.5° < θ < 22.5°). Shadow, SEM (bootstrap).
