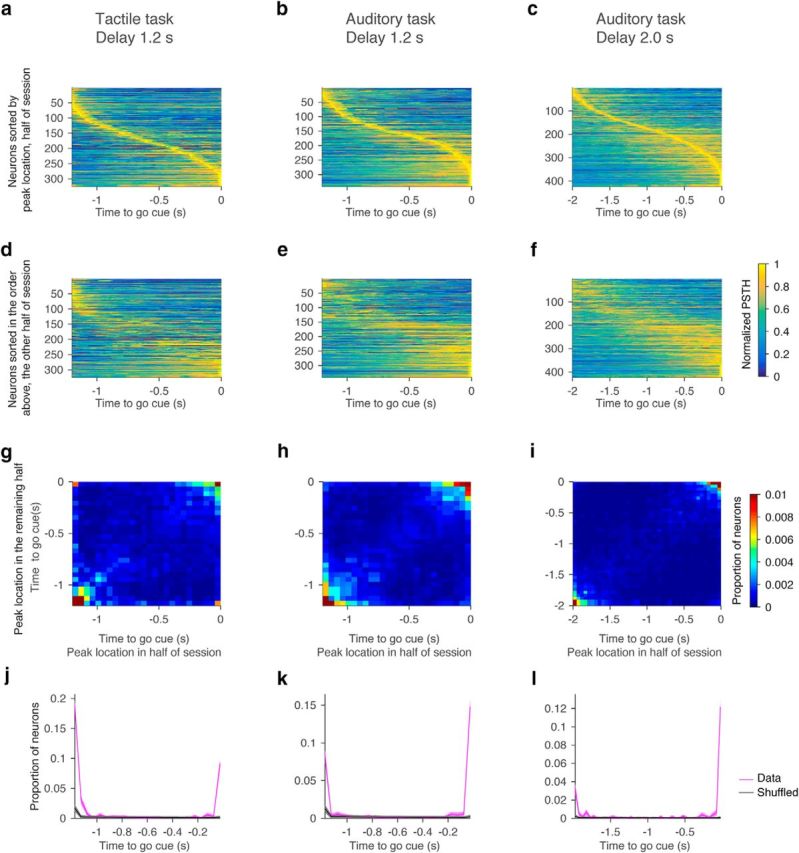
Figure 13.

Activity peaks are at the beginning or end of the delay epoch. a–c, Location of activity peaks in randomly selected half of trials. Neurons were sorted by the activity peak location. Each row, PSTH of each cell normalized by its peak (colormap). d–f, Location of activity peaks in the remaining half of trials. Neurons were sorted in the same order as in a–c. g–i, Heatmaps indicating the density of peaks in the randomly selected half of trials and in the rest of trials (see Materials and Methods). Bin size, 50 ms. j–l, Proportion of neurons with peak at each time point (magenta). This corresponds to proportion of neurons on the positive diagonal axis in g–i. Black, Chance level (Materials and Methods). Shadow, SEM (bootstrap).
