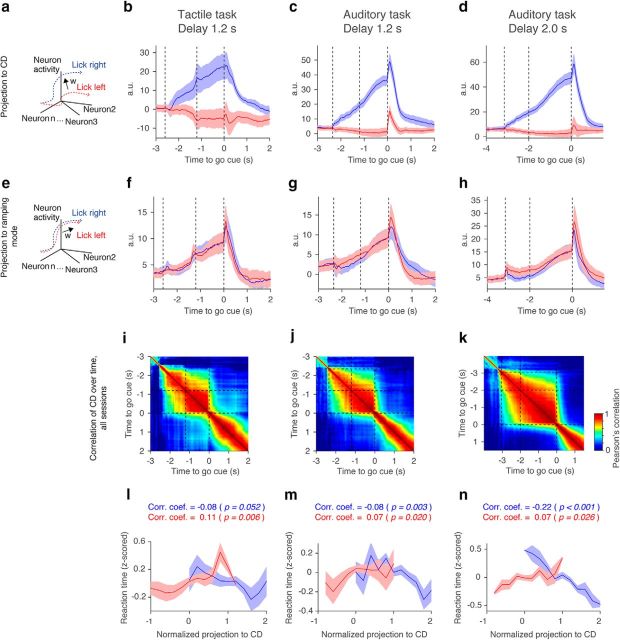
Figure 15.
Stability of the CD. a, Definition of CD as the direction that best differentiates trial-type-related activity. b–d, Projection to the CD. Shadow, SEM (bootstrap). e, The RM is the first SVD mode capturing the largest remaining variance not explained by CD (see Materials and Methods). It captures nonselective ramping as shown in f–h. f–h, Projection to the RM. Shadow, SEM (bootstrap). i–k, Stability of CD. CD was calculated at each time point and compared with CD calculated at a different time point using Pearson's correlation (see Materials and Methods). l–n, Relationship between normalized CD and reaction time (see Materials and Methods). Trials from all sessions were pooled and binned (see Materials and Methods). Lower values correspond to faster reaction times. Normalized projection to CD; 0, corresponds to median activity on ipsi trials; 1, same for contra trials. Note that the projection to the CD and the reaction time show negative correlations in contra trials but positive correlations in ipsi trials. p, Probability that correlation coefficient is significantly different from 0 (hierarchical bootstrap).

