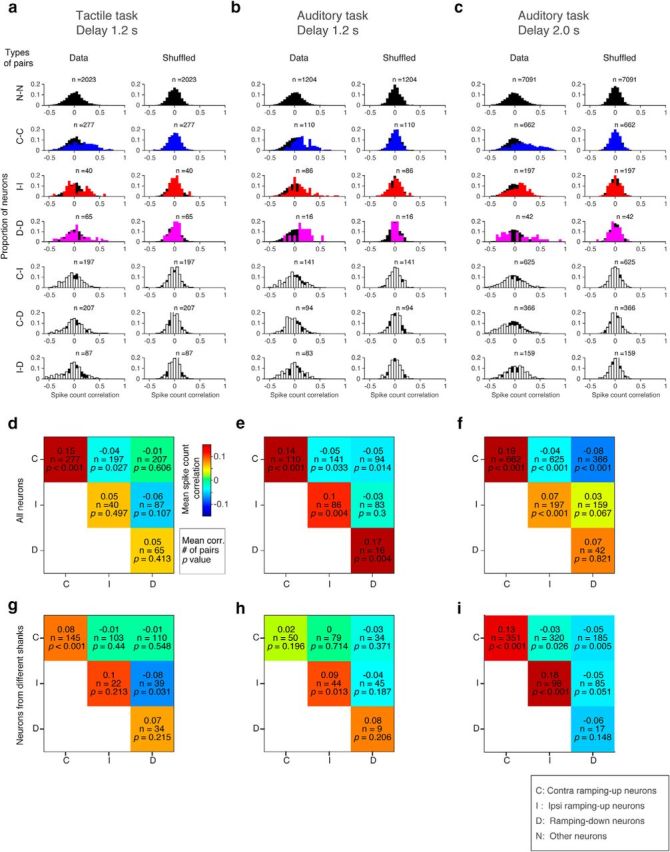
Figure 18.

Spike-count correlation. a–c, Distribution of spike-count correlation between different subtypes of neurons in contra trials (left). Distribution is overlaid on top of the distribution of nonselective cells (black) for comparison. As a control, trials were shuffled for each neuron. Spike-count correlation of the shuffled data is shown in the same format (right). C, Contra-preferring ramping-up cells; I, ipsi-preferring ramping-up cells; D, ipsi-preferring ramping-down cells; N, other cells. Numbers of pairs are shown on top of the histogram. d–f, Mean spike-count correlation between different subtypes of neurons in contra trials. Spike-count correlation is shown in pseudocolor (colormap: red, positive; blue, negative). Numbers of samples and p values (see Materials and Methods) are shown below the noise correlation in each grid. g–i, Mean noise correlation between different subtypes of neurons from different shanks.
