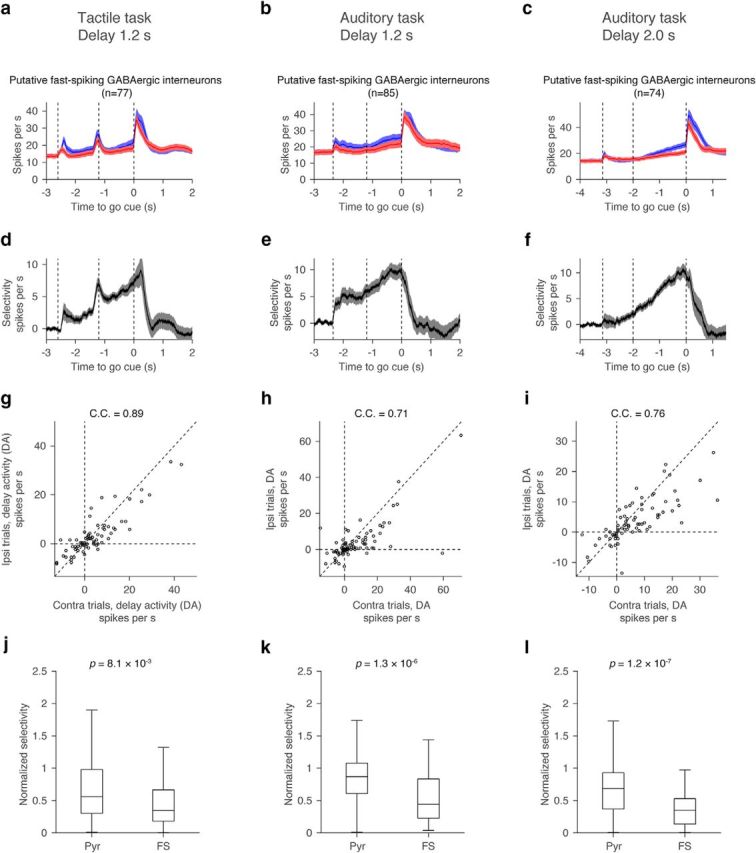
Figure 9.

Selectivity of putative FS neurons. a–c, Grand mean PSTH for all FS neurons. Shadow, SEM (bootstrap). d–f, Grand mean selectivity of FS neurons with significant delay selectivity. Shadow, SEM (bootstrap). g–i, Distribution of contralateral and ipsilateral DA for all FS neurons. Each circle corresponds to each cell. C.C., Correlation coefficient of contralateral and ipsilateral DA. Diagonal dashed line, Line with slope 1. j–l, Normalized selectivity of putative pyramidal neurons (pyr) and FS neurons. For these figures, normalized selectivity was measured for neurons with positive DA (DAcontra + DAipsi > 0). Central line in the box plot is the median. Top and bottom edges are 75 and 25 percentage points, respectively. The whiskers show the lowest datum within 1.5 interquartile range (IQR) of the lower quartile, and the highest datum within 1.5 IQR of the upper quartile. P values, Mann–Whitney U test.
