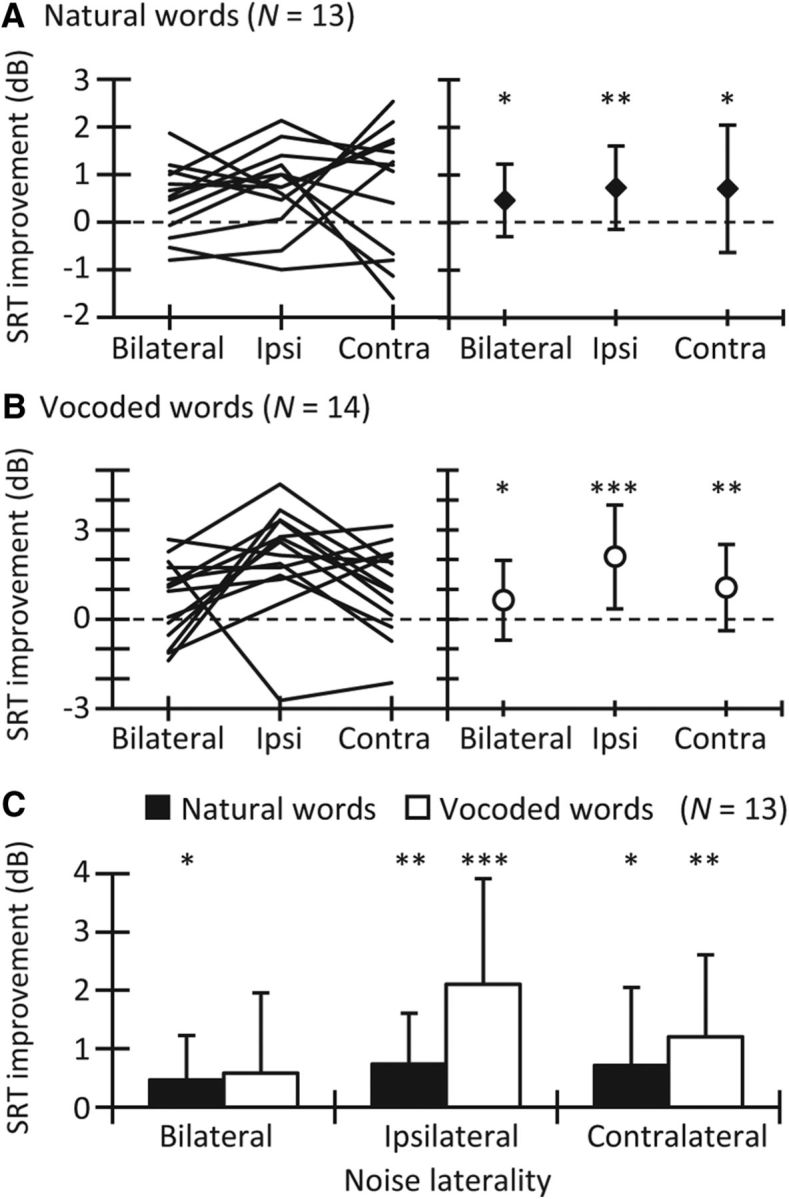
Figure 3.

Improvement in SRT for words delayed 300 ms from the noise onset. Data are for NH listeners and for the three noise lateralities, as indicated in the abscissa of each panel. A, For natural words. Each line in the left panel represents data for one participant (N = 13), and symbols in the right panel illustrate the mean data (±1 SD). B, For vocoded words (N = 14). The layout is the same as in A. C, Mean data for natural and vocoded words (N = 13) replotted from A and B. Error bars represent 1 SD. Asterisks indicate statistically significant differences: *p < 0.05; **p < 0.01; ***p < 0.001. Contra, Contralateral; Ipsi, ipsilateral.
