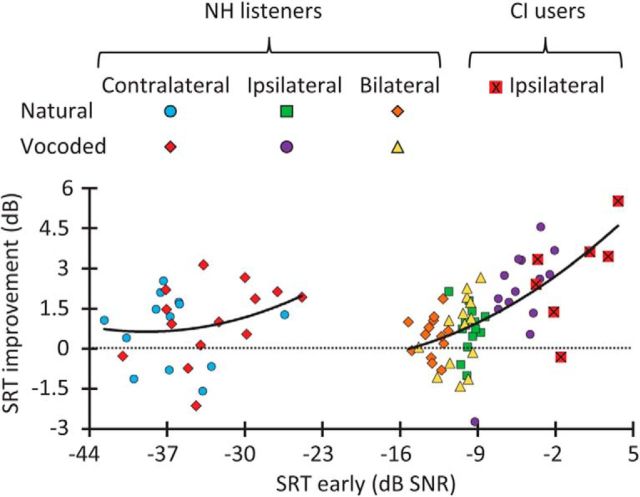
Figure 5.
SRT improvement against the SRT in the early condition. Data are shown for all conditions and participants. The two continuous lines illustrate second-order polynomial fits to the data for contralateral noise conditions (left) and for the other conditions (right) separately. Notice that the worse (higher) the SRT in the early condition, the greater the SRT improvement (see main text for details).

