
Figure 4.
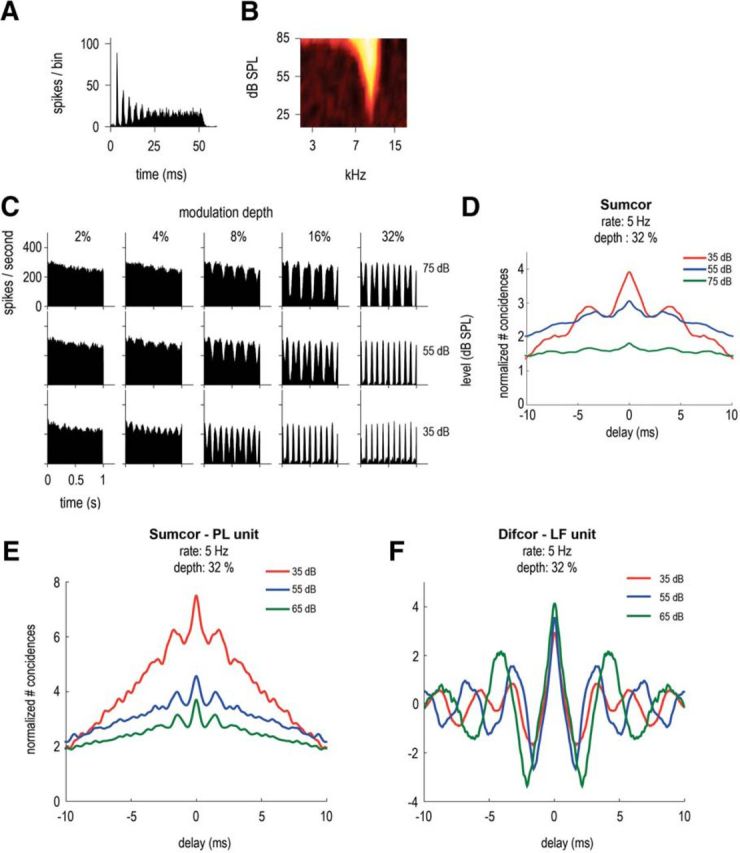
Level dependence of the ENV responses of a CS unit, with BF = 9.5 kHz, SR = 35.4 spikes/s, T = 23 dB SPL. A, Pure tone PSTH (20 dB above threshold). B, Receptive field. C, PSTHs in response to 5 Hz SFM presented at BF and at 3 stimulation levels: 35, 55, and 75 dB SPL (in rows) and 5 modulation depths: 2, 4, 8, 16, and 32% (in columns). D, Sumcor (average SAC and XAC) for 5 Hz SFM stimuli at modulation depth = 32% at the 3 presentation levels (35, 55, and 75 dB SPL in red, blue and green). E, Sumcor of another high-BF unit: PL, BF = 9.2 kHz, at different presentation levels in dB SPL (in response to SFM stimuli: 5 Hz rate and 32% depth). F, Difcor of a low-BF unit: LF, BF = 417 Hz, at different presentation levels in dB SPL (in response to SFM stimuli: 5 Hz rate and 32% depth).