
Figure 7.
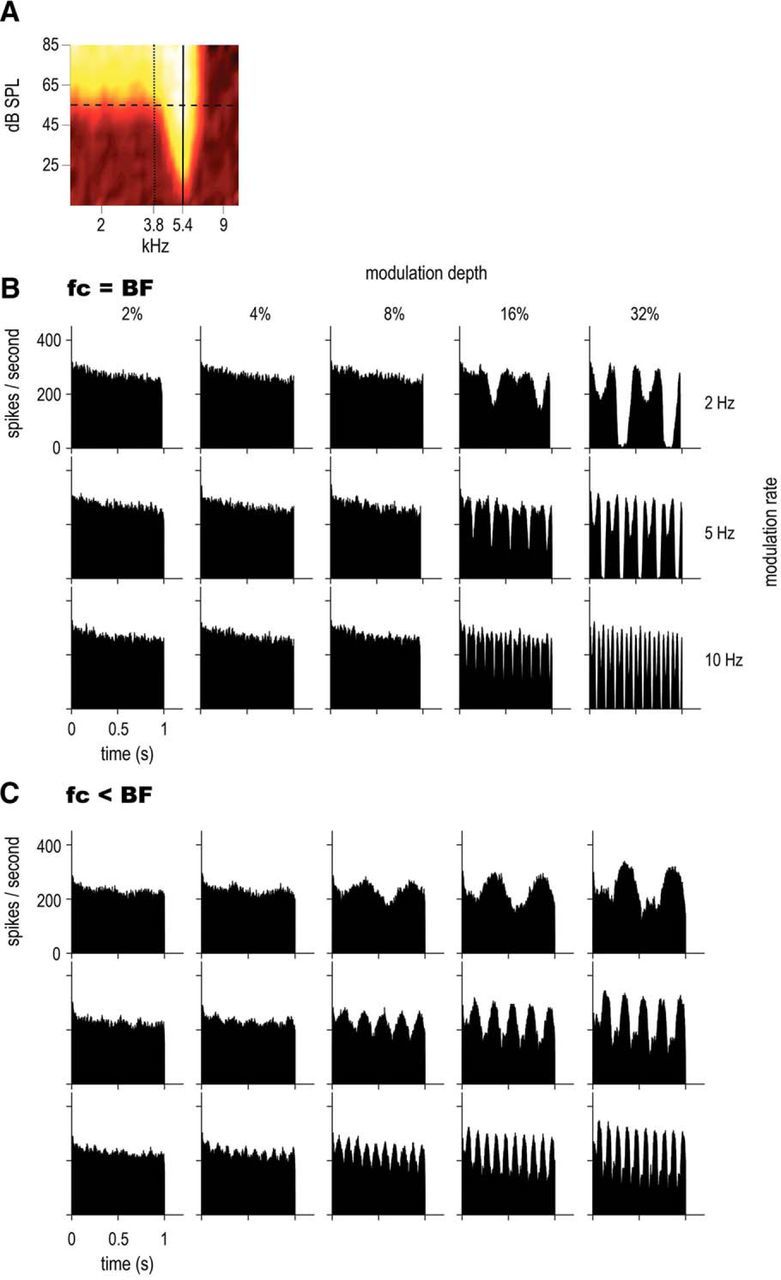
Comparison of on-BF and off-BF responses of a CS unit, with BF = 5.4 kHz, SR = 71.0 spikes/s, T = 20 dB SPL. A, Receptive field. The solid line indicates the on-BF position (carrier frequency at BF) and the dotted line the off-BF position. B, PSTHs in response to on-BF SFM presented at 55 dB SPL (horizontal dashed line) at 3 rates: 2, 5, and 10 Hz (in rows) and 5 modulation depths: 2, 4, 8, 16, and 32% (in columns). The fc was set to the same value as BF (5.4 kHz). C, PSTHs in response to off-BF SFM (same conditions as B); fc was set to 3.8 kHz.