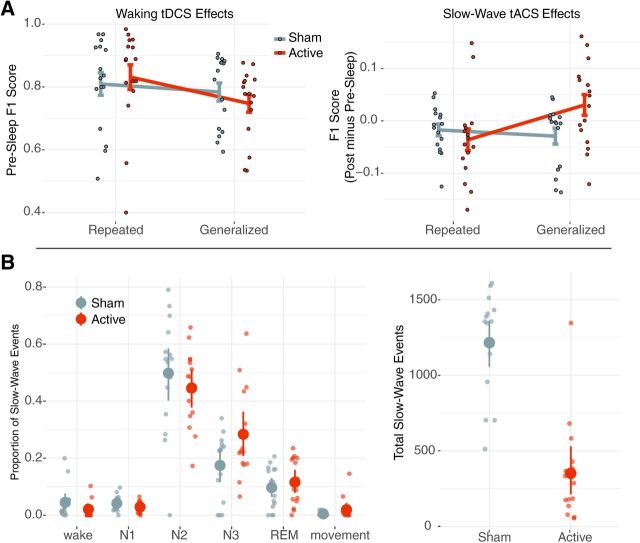
Figure 3.
A, Left plot, The behavioral effects from waking tDCS. Target detection F1 score from the test immediately following training plotted as an interaction of image type by stimulation condition. No significant main effects were observed, and a marginal interaction was found. The right plot shows overnight closed-loop slow-wave tACS effects. Here the change in F1 score from the average postsleep − presleep performance is shown as an interaction between image type and stimulation condition. Critically, a significant interaction between image type and stimulation condition showed an increased overnight change in F1 score for generalized images in the active condition. Each dot is a given participant's performance, and error bars show the SEM. B, Left plot, Detected SW events broken down per sleep stage as a proportion of the overnight total for each subject and condition. Here stages N2 and N3 on average had more SW events than all other stages. Right plot shows total SW events for each stimulation condition. Here active stimulation had fewer total SW events compared with sham. Small dots reflect individual subjects, large dots reflect the group mean, and error bars are boot-strapped 95% confidence intervals.

