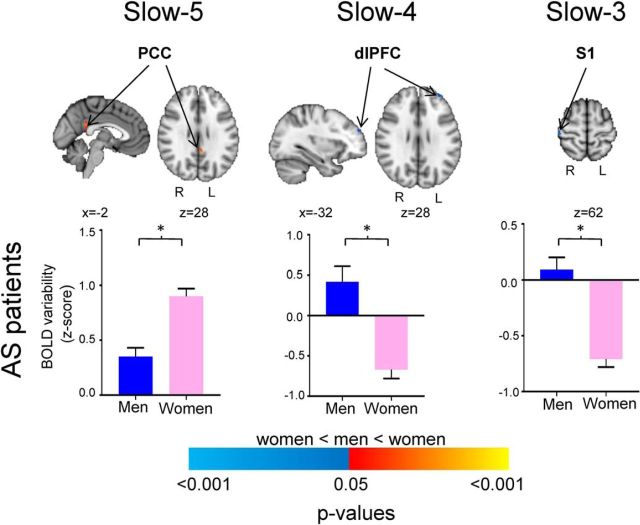
Figure 4.
Frequency-specific sex differences in BOLD signal variability/LFOs in healthy controls and AS patients. The histograms (blue, men; pink, women) represent the standardized BOLD signal variability values (z-scores) extracted from the significant clusters derived from the contrast maps between men and women. The significant clusters are depicted in the brain maps shown to the right of each graph. All significant clusters are thresholded at p < 0.05 (FWE corrected). Warm colors represent brain areas in which women had greater BOLD signal variability/LFOs compared with men, and cool colors represent brain areas in which women had lower BOLD signal variability/LFOs compared with men. S1, Primary somatosensory cortex; dlPFC, Dorsolateral prefrontal cortex; PCC, Posterior cingulate cortex; *p < 0.05, FWE-corrected.

