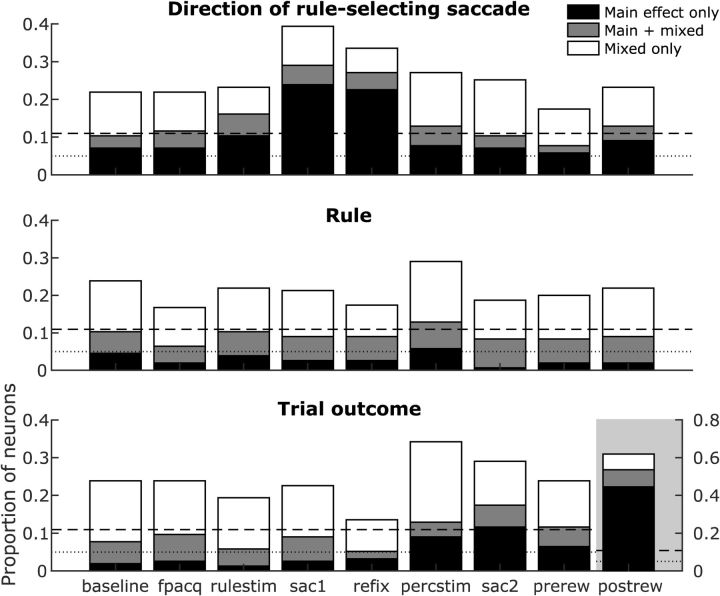
Figure 2.
Summary of task-related activity modulations. Each set of graphs show the proportions of SEF neurons that exhibited significant main effects, mixed selectivity, or both for saccade direction (top), rule (middle), and trial outcome (bottom) in each task epoch. Dashed line represents the corrected significance cutoff for n = 155 neurons (18/155 neurons or a proportion of 0.116, determined by χ2 test). Dotted line represents the uncorrected significance cutoff α = 0.05. Note the different y-axis scale for trial outcome during the postrew epoch (gray background).

