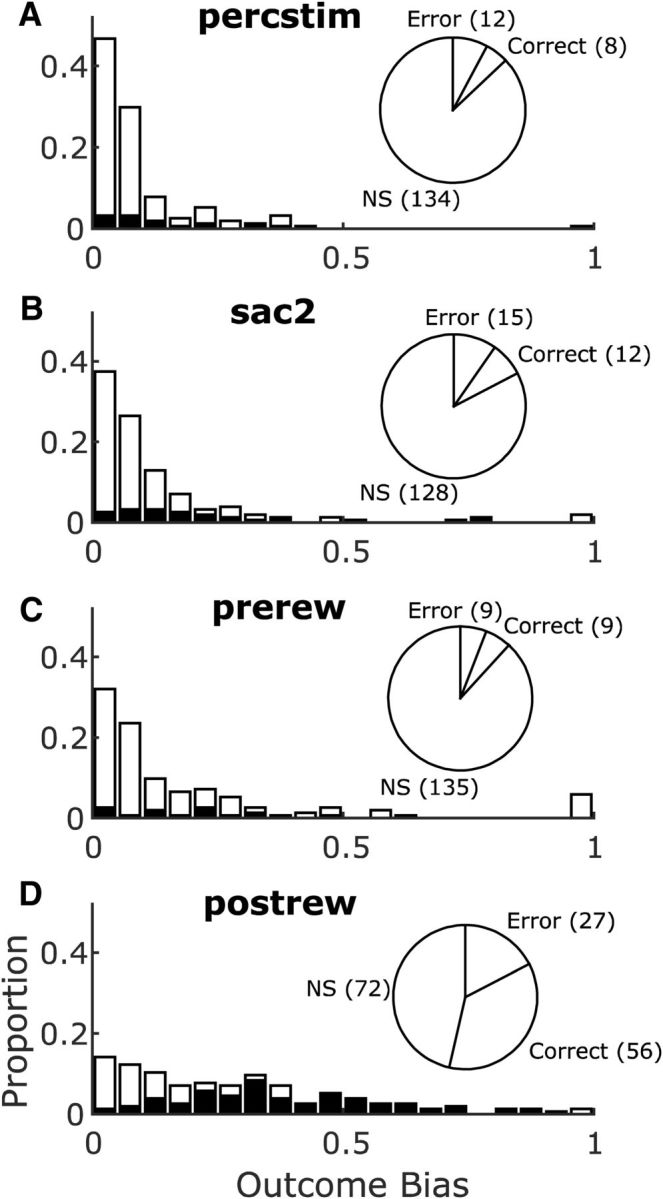
Figure 6.

Selectivity for trial outcomes in the SEF neurons. Pie charts show numbers of outcome selective neurons and their preference (correct trials, error trials, or NS, nonselective). Histograms show magnitudes of the neurons' significant (black) or nonsignificant (white) outcome selectivity biases. Results shown separately for the percstim epoch (A), the sac2 epoch (B), the prerew epoch (C), and the postrew epoch (D).
