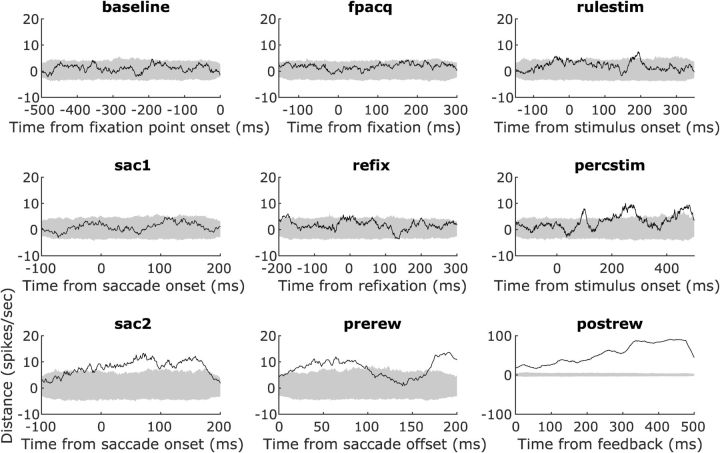
Figure 9.
Population dynamics of trial outcome encoding. Time courses calculated using the multidimensional distance (Stokes et al., 2013) between neuronal trajectories on correct and error trials. Distances (solid black lines) were significant when they exceeded the 99% confidence interval (gray shaded area) of the null distribution (see “Population dynamics” section in Materials and Methods for more details). Significant, strong trial outcome signals appeared after onset of the decision targets (percstim), persisted during (sac2) and after (prerew) the rule-implementing saccades, and peaked after feedback (postrew; for this, note the different y-axis scale).

