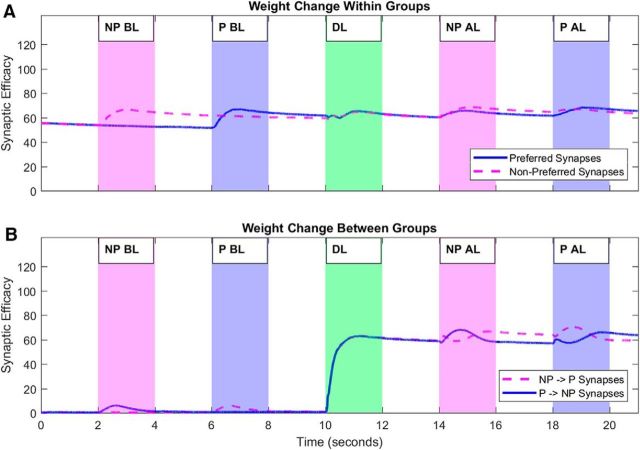
Figure 2.
Hippocampal weight change throughout the simulation both within (A) and between subgroups (B) that code for the P and NP stimulus. Weights within each subgroup increase when the relevant image is presented (A), where the magenta and blue periods indicate the presentation of the NP and P images, respectively, and the green period indicates the presentation of both images combined into a composite image. During this learning period, weights from the NP to the P subgroup (magenta dashed line) and vice versa (solid blue line) increase (B). Outgoing weights then increase upon the presentation of the relevant stimulus after learning (AL). Incoming weights also increase a small amount before learning (BL), then decay back to zero.

