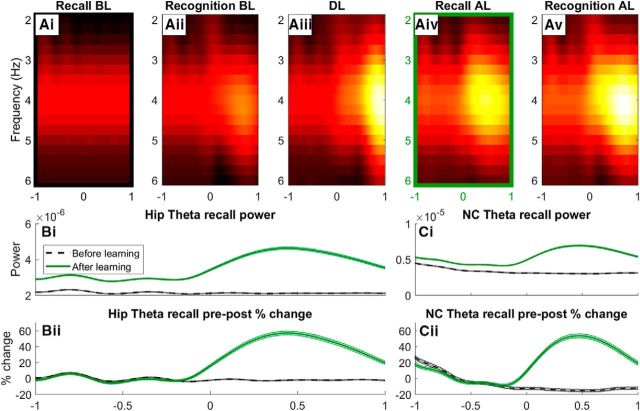
Figure 6.
Time–frequency analysis (TFA) of hippocampal theta for the recall and recognition conditions before and after learning (Ai, Aii, Aiv, Av), as well as for during learning (Aiii). A time course of theta power is shown (B) for the color-coded highlighted boxes (Ai, Aiv), where pure power (Bi) and percentage change in prestimulus and poststimulus power (Bii) are shown. The same analysis is shown for neocortical theta power during the same time periods (Ci, Cii).

