Figure 7.
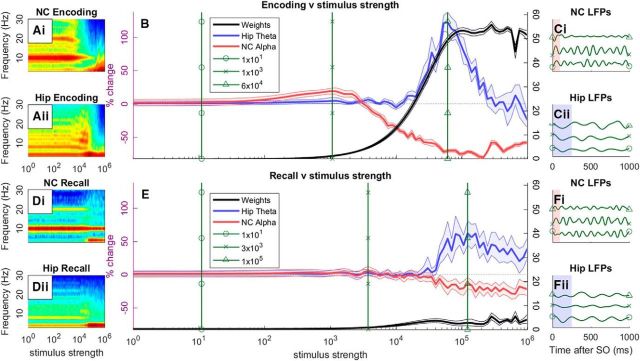
Increasing stimulus strength (number of spikes being fed into NC neurons) during the encoding (DL) and recall after learning conditions, where stimulus strength is depicted on a logarithmic scale. During the encoding stage (A–C), frequency by strength heat maps of NC (Ai) and hippocampus (Aii) are shown. From these data, relative changes in NC alpha (B, red; 8–12 Hz) and hippocampal theta power (B, blue; 3–5 Hz) are plotted, as well as weight change between P and NP hippocampal subgroups (B, black). From this plot, three different stimulus strength values are chosen: normal oscillatory activity (∼101 strength), small alpha power increases (∼103 strength) and maximal theta power increases (∼105 strength). At these points, LFPs are calculated using specific 2–6 or 8–12 Hz filters for hippocampal theta (Cii) and NC alpha (Ci), respectively, where blue and red highlighted regions indicate the possible stimulus onset area due to realigning phases across multiple trials. The same symbols indicate at which point an LFP represents. The same format is applied for the recall after learning condition (D–F).

