Figure 10.
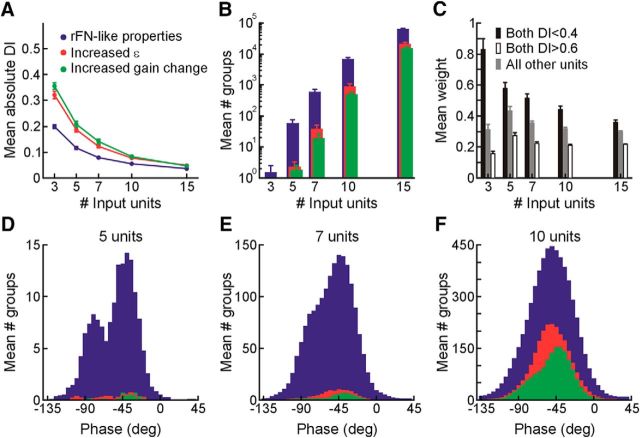
Decoding performance as a function of the number of synthetic input units and specific tuning properties. A, Mean output DI across directions, head reorientation angles, and planes plotted as a function of input unit group size. For each direction, average DIs were calculated based on the representations decoded from the 100 groups that yielded the lowest DIs while also meeting the following output criteria for decoding across head angles of up to ±90° for reorientation in each plane: (1) average absolute ε <15% the angular change in head orientation angle; (2) average gain changes relative to upright of <15%; and (3) average phase change relative to upright <10°. For each input unit group, only the DI at the phase yielding the best decoding performance (lowest regression mean-squared error) was included in the average. The plot shows the mean (±standard error [SE]) of the average DI values across the 12 motion directions (excluding 90° elevation) that yielded similar performance (see Results). Blue denotes decoding performance for input units with properties similar to those of our recorded rFN neurons. Red denotes decoding performance for input units with ε values for reorientation in each plane increased by 8° to 16°. Green denotes decoding performance for input units with “gain-field” sensitivities in units of percentage gain change per degree of head angle increased by 0.5%/° to 1%/° (see Materials and Methods). B, Number of input unit groups of each size (mean ± SE across 12 directions) that yielded decoded representations meeting the criteria in A and having average absolute DIs < 0.15 across head angles up to ±90° for reorientation in each plane. Red, blue, and green denote decoding using input units with tuning properties as described in A. C, Average decoding weight amplitudes for input units in the groups that yielded successful body-centered representations (as defined by the criteria in A and B). Weights are classified according to input unit tuning characteristics. Black denotes tuning closer to body-centered (both horizontal and vertical-plane DIs < 0.4). White denotes closer to head-centered (both DIs > 0.6). Gray denotes intermediate tuning (i.e., all other units). The plot shows the mean (±SE) of the average decoding weights across 12 motion directions. D–F, Distributions of phases that could be successfully decoded to yield body-centered representations (according to the criteria in A and B) for 5 unit (D), 7 unit (E), and 10 unit (F) input groups. For each direction, histograms reflect the phase distributions associated with a maximum of 800 input unit groups (with lowest output DIs) but including all group and weight combinations yielding body-centered representations (i.e., with different decoding weights each group could contribute to decoding across multiple phases). Each histogram is the average of the histograms computed individually for 12 motion directions. Red, blue, and green denote decoding using input units with tuning properties as described in A.

