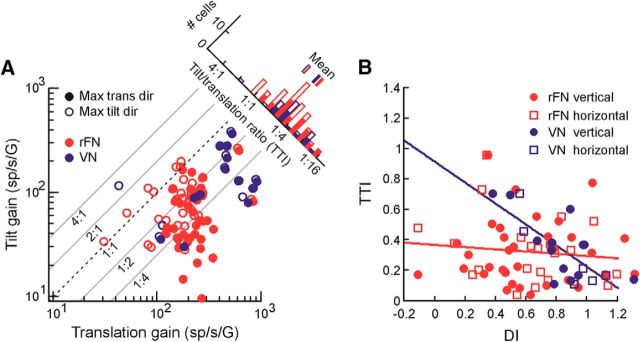
Figure 11.
Relationship between cell responses to translation versus tilt and extent of reference frame transformation. A, Comparison of response gains for translation versus tilt (expressed in units of spikes/s/G) along the horizontal plane direction of maximum response to translation (filled symbols) and to tilt (open symbols). Top right, Histogram showing the distribution of the TTI (tilt/translation gain ratio) for rFN (red) and VN (blue) cells. Filled bars denote the maximum translation gain direction. Open bars denote the maximum tilt gain direction. Bars above the plot indicate mean values. B, Relationship between each cell's TTI in the horizontal-plane direction of maximum translation gain and its DIs for vertical plane (filled circles) and horizontal plane (open squares) head reorientation. Linear regressions are shown for rFN cells (red, r = −0.11, p = 0.42) and VN cells (blue, r = −0.74, p = 0.0003).

