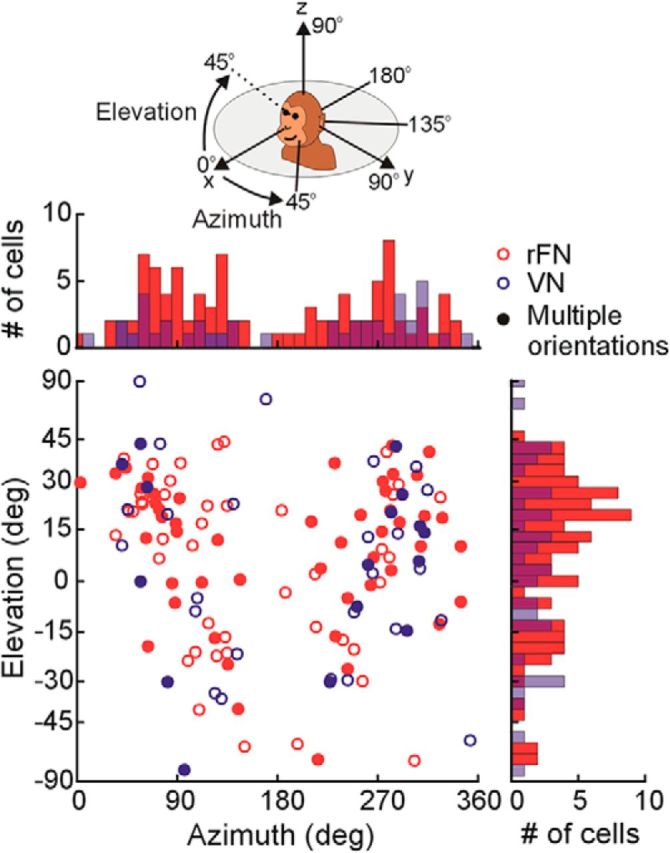
Figure 2.

Distribution of preferred translation directions of rFN (red; N = 95) and VN (blue; N = 46) cells. Each data point in the scatter plot indicates the preferred azimuth (abscissa) and elevation (ordinate) with elevation angle spacing scaled according to Lambert's equal area projection of the spherical stimulus space. Histograms along the top and right sides of the plot show marginal distributions. Filled symbols denote cells for which tuning functions were characterized across multiple head orientations.
