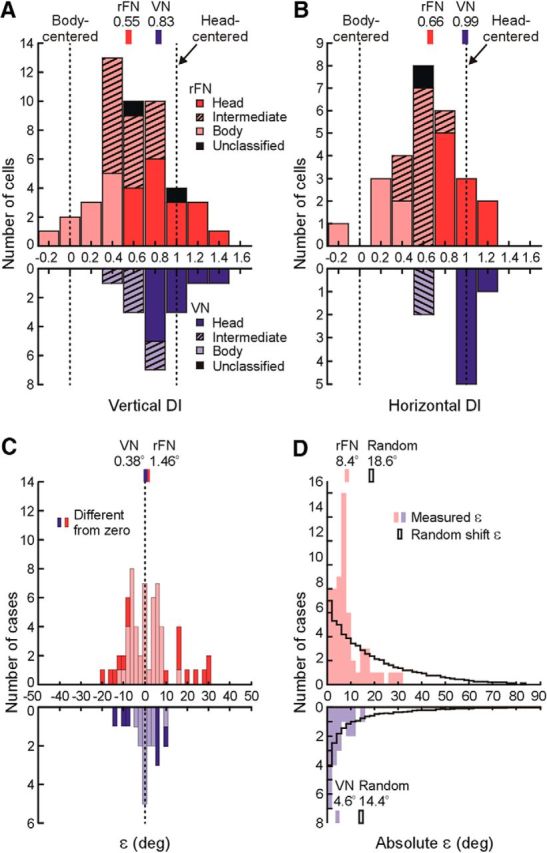
Figure 5.

Distribution of DIs and ε values. DI values of 0 and 1 indicate tuning shifts consistent with body- and head-centered encoding of translation, respectively. A, DI distribution for vertical-plane head reorientation. B, DI distribution for horizontal-plane head reorientation. rFN (red; vertical, N = 47; horizontal, N = 27) and VN (blue; vertical, N = 16; horizontal, N = 8) cell DIs are classified based on bootstrapped DI 95% CIs as body-centered (pale colors), head-centered (dark colors), or intermediate (hatched). Cells for which bootstrapped DI CIs included both 0 and 1 were labeled as unclassified (black; N = 2 for rFN vertical; N = 1 for rFN horizontal). Vertical red and blue bars above the plots indicate the medians of each population. C, Distribution of ε values across vertical and horizontal head reorientations. Dark colors denote a significant difference from zero (N = 16 of 62 cases for rFN; N = 7 of 20 cases for VN). Vertical red and blue bars above the plot indicate the means of each population. D, Distributions of measured absolute ε values across vertical and horizontal head reorientations (pale red, rFN; pale blue, VN) superimposed on the distributions of absolute ε values predicted for random tuning shifts (black outlines) producing similar DI distributions to those measured experimentally. Vertical colored and black outlined bars above the plot indicate the means of each distribution.
